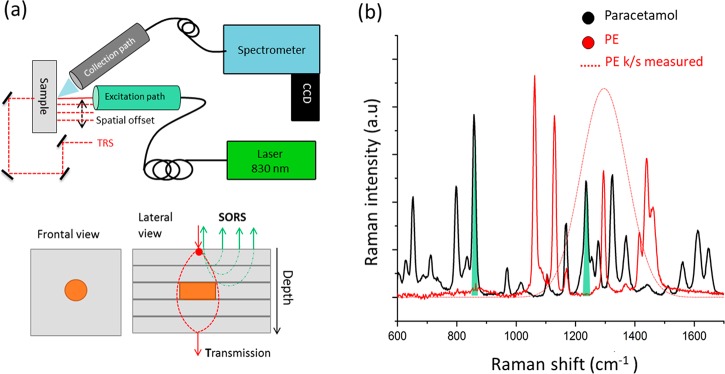
Figure 1.
(a) (upper panel) Experimental setup of the Raman system used for SORS and TRS measurements. (lower panel) Schematic diagram of the model sample and measurement configuration. (b) Raman spectra of the inclusion (paracetamol - black line) and the diffuse matrix (PE - red line). Green shaded areas highlight the paracetamol Raman bands used in further analysis (857 and 1235 cm–1). The red dotted line denotes the k/s Kubelka–Munk function of the turbid matrix (PE). Each figure must have a caption that includes the figure number and a brief description.

