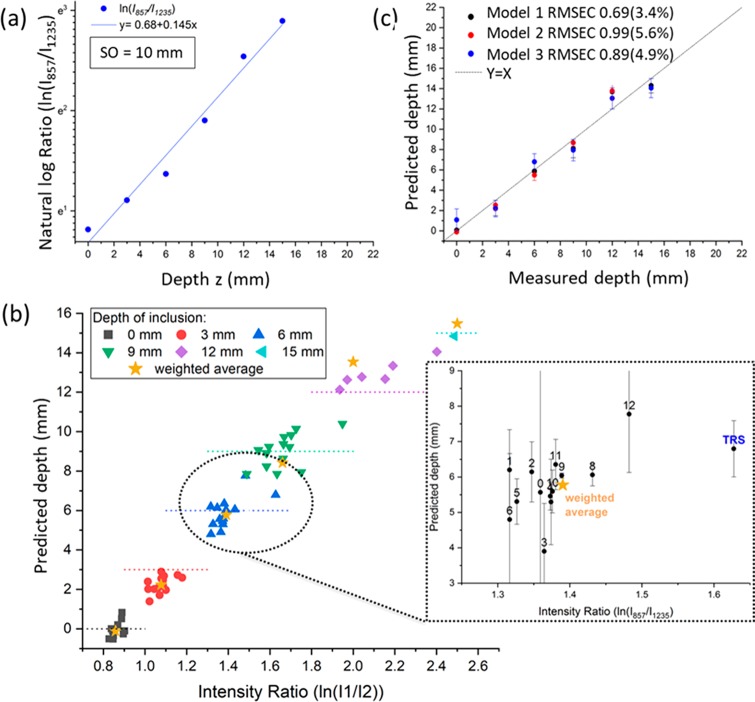
Figure 3.
(a) Natural logarithm of the 857-to-1235 cm–1 ratio of paracetamol peaks (blue dots), with linear fit used as a calibration curve for the creation of the model (blue line). (b) Predictions of a paracetamol inclusion depth resulting from all SORS and TRS measurements; the horizontal line indicates the actual depth; orange stars indicate the weighted average resulting from the proposed combined approach. (c) Predicted vs measured depth obtained with the three models based on averages weighted for the accuracies of the performance of individual models built for each individual spatial offset and transmission data sets. Model 1 is based on all SORS (SO: 0 to 12 mm) and TRS measurements. Model 2 is based on the measurement of all spatial offsets for SORS alone (SO: 0 to 12 mm). Model 3 is based on TRS measurements alone.

