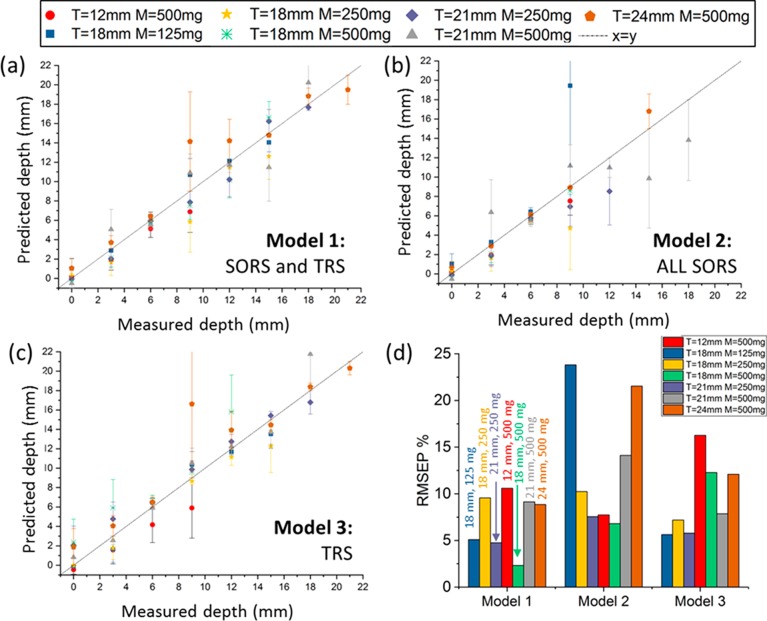
Figure 4.
(a–c) Prediction of the paracetamol depth in the PE matrix of different thickness (t = 12, 18, and 24 mm) and for different amounts of inclusion (m = 500, 250, and 125 mg). (d) Root mean square error of prediction (RMSEP) expressed in terms of percentages. Model 1 is based on all SORS (SO: 0 to 12 mm) and TRS measurements. Model 2 is based on the measurement of all spatial offsets for SORS alone (SO: 0 to 12 mm). Model 3 is based on TRS measurements alone.

