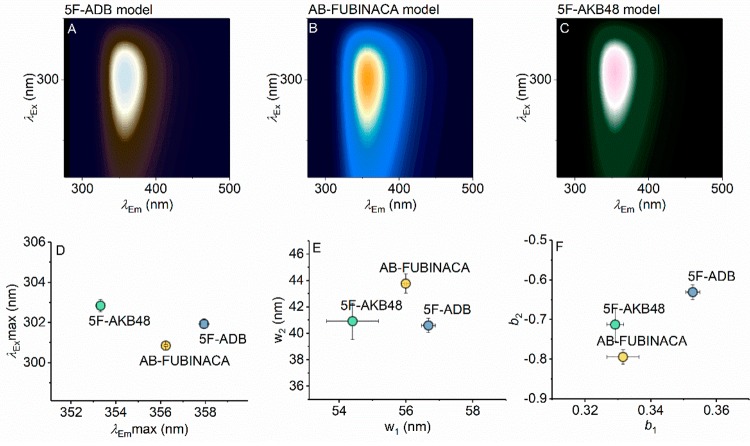
Figure 3.
Surface fits of eq 1 to the data shown in Figure 2A–C (panel A, 5F-ADB; panel B, AB-FUBINACA; panel C, 5F-AKB48). The resulting parameters from fitting to eq 1 are shown in panels D–F, for maxima of excitation/emission, spectral width, and skewness, respectively. Error bars are the standard deviation from fitting three to five different concentrations of each SCRA (∼1–5 μg mL–1). Color levels as in Figure 2 (relative emission).

