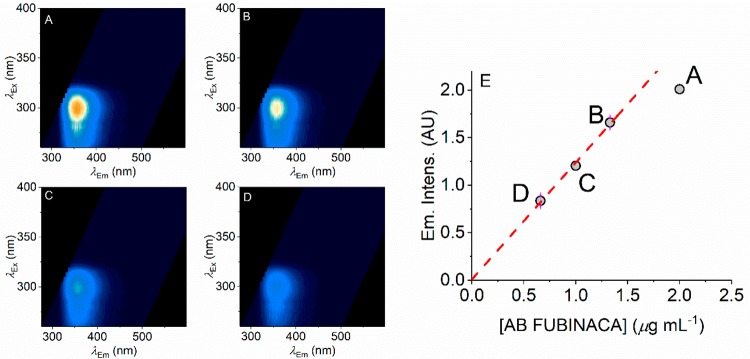
Figure 4.
Concentration dependence of AB FUBINACA FSFs. (A–D) FSFs for different concentrations of AB FUBINACA with decreasing concentration shown in panels A → D. (E) Plot of concentration versus peak emission intensity. The red dashed line shows the linear dependence of the lower (first three) concentrations with the higher concentration deviating from linearity as discussed in the main text. Color levels as in Figure 2B (relative emission).

