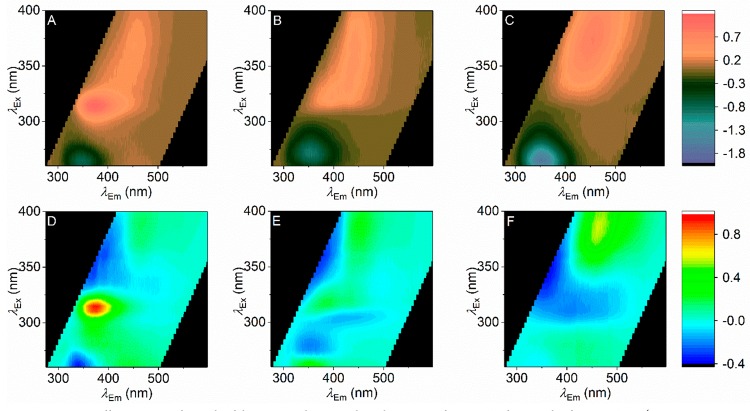
Figure 7.
(A-C) Difference FSFs for each of the SCRAs shown as the subtraction of Figure 6A from each of Figure 6D–F (panel A, 5F-ADB; panel B, AM-694; panel C, 5F-PB-22). (D–F) Residuals arising from the fit of the model shown in Figure 6B to each of the SCRA + oral fluid FSFs shown in Figure 6D–F (panel D, 5F-ADB; panel E, AM-694; panel F, 5F-PB-22).

