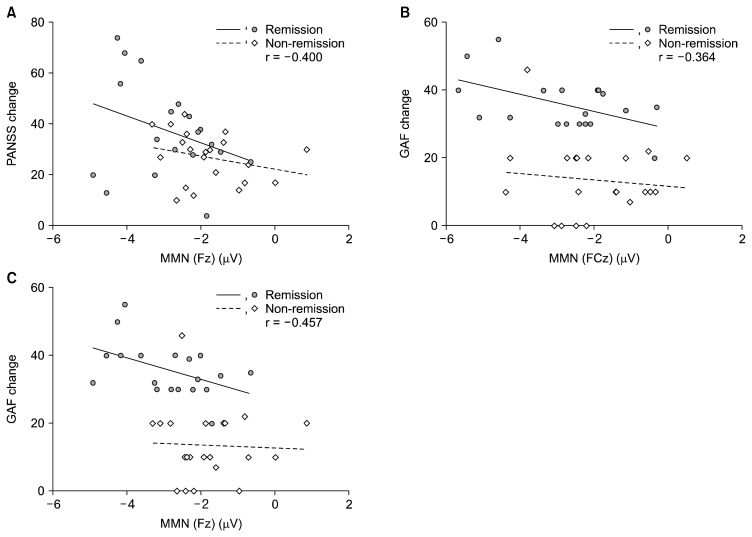
Fig. 2.
(A) Scatter plots of mismatch negativity (MMN) at the Fz electrode and Positive and Negative Syndrome Scale (PANSS) changes (initially measured PANSS–re-measured PANSS). (B) Scatter plots of MMN at the FCz electrode and Global Assessment of Functioning (GAF) changes. (C) Scatter plots of MMN at the Fz electrode and GAF changes.

