Figure 1.
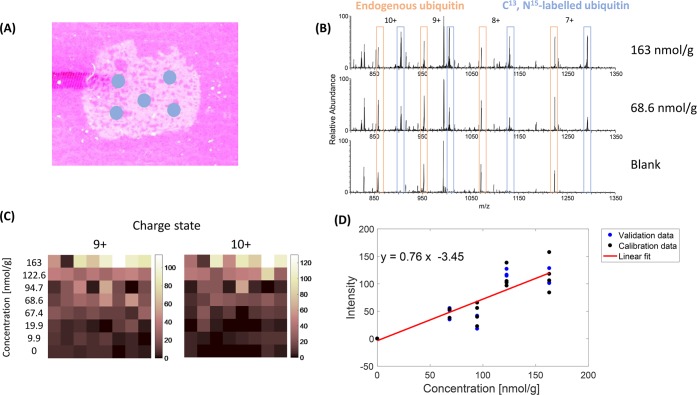
(A) Rat brain tissue mimetic section mounted on a glass slide with LESA sampling points indicated. (B) Mass spectra of the rat brain tissue mimetic models. Top, 163 nmol/g of labeled ubiquitin; middle, 68.6 nmol/g of labeled ubiquitin; bottom, blank mimetic. (C) Ion intensity image comparison of labeled ubiquitin in charge states 9+, m/z 1005.1788 and 10+, m/z 904.7624 in tissue mimetic models. Each horizontal line represents one mimetic concentration in nmol/g. (D) Calibration curve for the 9+ charge state of labeled ubiquitin. Calibration data points are shown in black; validation data points are shown in blue. Least squares fitting was applied to the calibration data.

