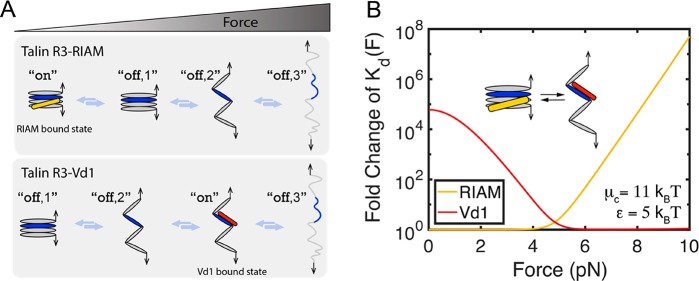
Figure 5.
Force-dependent switching of Vd1 and RIAM binding to talin R3. (A) Schematics of states involved in R3–RIAM interaction and R3–Vd1 interaction. (B) Fold change in Kd(F) of talin R3–RIAM interaction [the yellow curve shows the ratio of Kd(F) to Kd0 in eq 3] and talin R3–Vd1 interaction [the red curve shows the ratio of Kd(F) to Kd,o in eq 2].

