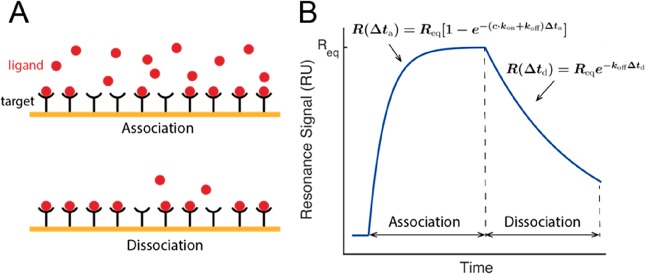
Figure 6.
Quantification of Kd based on measuring kinetic rates in SPR experiments. (A) Schematics of the association and dissociation phase in the Kd measurement. (B) Typical SPR signal. The kinetic rates (kon and koff) and binding affinity (Kd) can be determined by fitting the sensorgram data to an appropriate interaction model.

