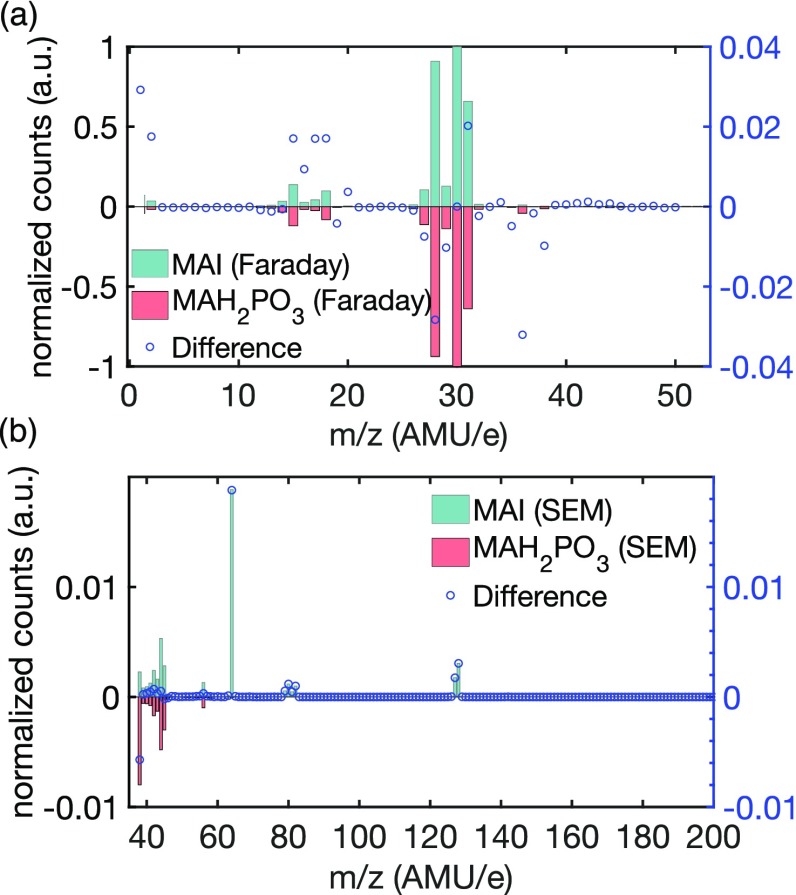
Figure 2.
(a) Comparison of the mass spectra of MAI and MAH2PO3, both recorded with the Faraday detector of the residual gas analysis (RGA) system. (b) Comparison of the higher m/z range of the mass spectrum of MAI and MAH2PO3, both recorded with the secondary electron multiplier (SEM) detector of the residual gas analysis (RGA) system. The difference between the mass spectra of the two measured substances was calculated by subtracting the normalized MAH2PO3 value from the normalized MAI value for each m/z value and is displayed as blue circles.

