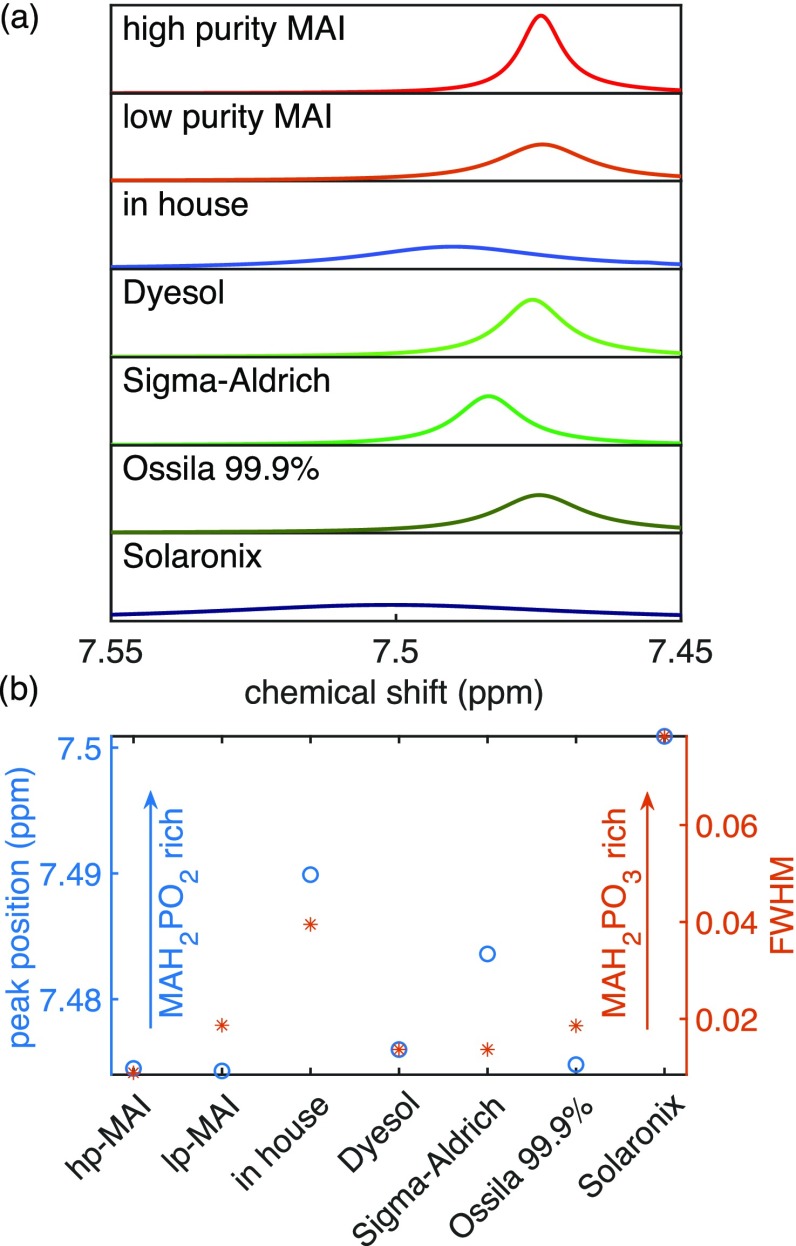
Figure 3.
1H NMR characterization of different MAI batches. Details like batch numbers can be found in the SI. (a) NMR spectra of different MAI batches shown from 7.55 to 7.45 ppm to focus on the NH3 proton MA peak. A clear shift of the peak maximum for different batches is observed. (b) Summary of the peak position and full width at half-maximum (FWHM) of the peak around 7.5 ppm for several MAI batches. A higher FWHM indicates that the batch is rich in MAH2PO3. A higher peak position indicates that it is rich in MAH2PO2.29

