
Figure 4.
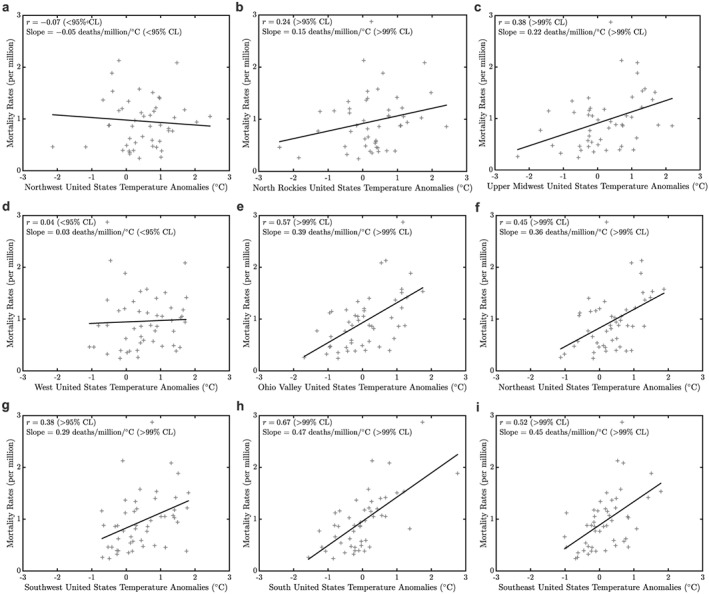
(a–i) Association between regional U.S. summer temperature anomalies and HRM rates from 1968–2016.
Official websites use .gov
A
.gov website belongs to an official
government organization in the United States.
Secure .gov websites use HTTPS
A lock (
) or https:// means you've safely
connected to the .gov website. Share sensitive
information only on official, secure websites.
(a–i) Association between regional U.S. summer temperature anomalies and HRM rates from 1968–2016.