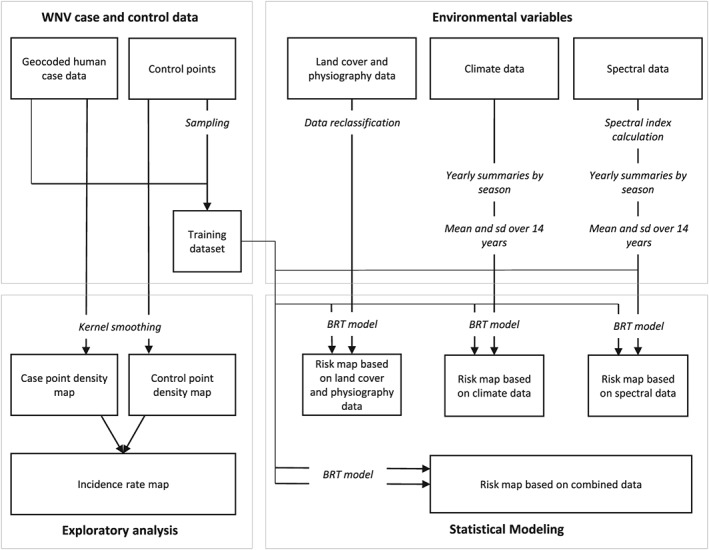
Figure 1.

Workflow for West Nile virus (WNV) modeling and risk mapping. The analysis is divided into four major sections. The processing of case and control data, an exploratory analysis of case and control data, the processing of environmental variables, and the statistical modeling to produce WNV risk maps. Bold text represents the four main sections; italic text represents data processing steps, boxes, and arrows represent the main data flows. BRT = boosted regression tree.
