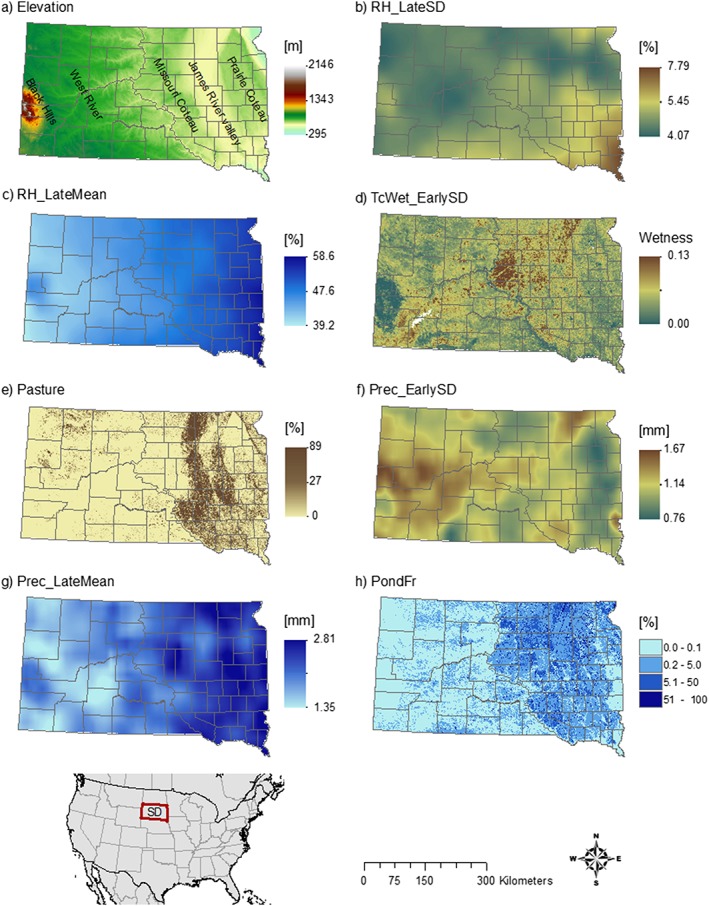
Figure 2.

Environmental variables mapped across South Dakota. (a) Elevation, (b) 14‐year standard deviation of relative humidity in July/August, (c) 14‐year mean of relative humidity in July/August, (d) 14‐year standard deviation of tasseled cap wetness in May/June, (e) percent pasture, (f) 14‐year standard deviation of precipitation in May/June, (g) 14‐year mean of precipitation for July/August, and (h) ponding frequency.
