Figure 3.

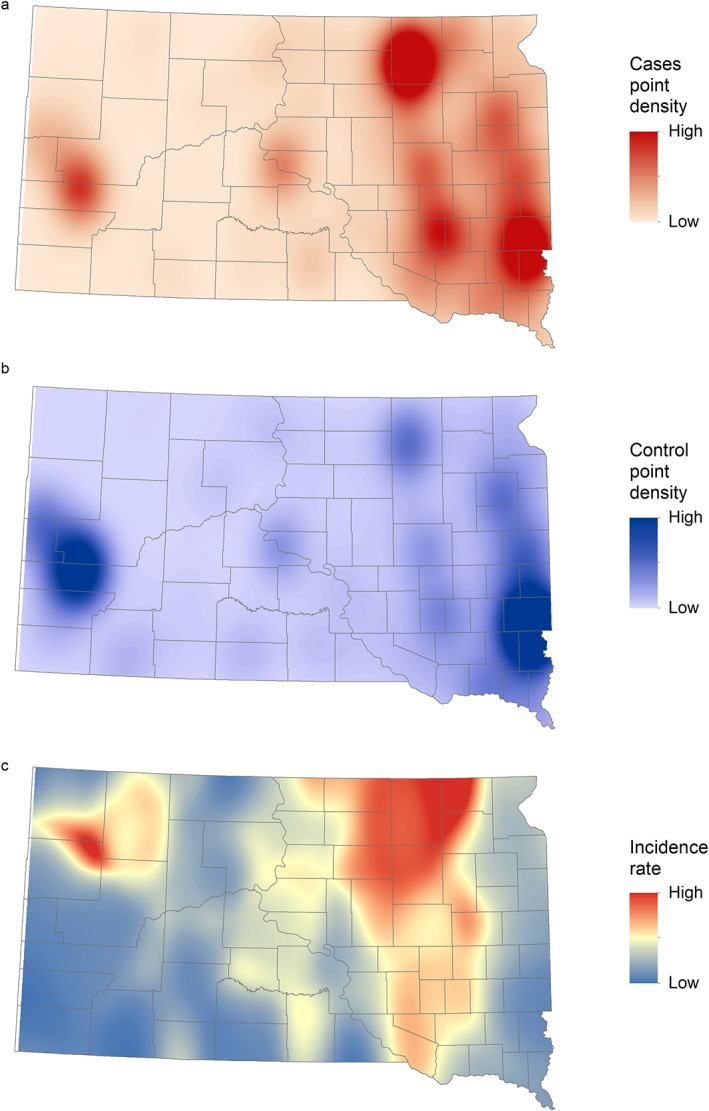
(a) Spatially smoothed West Nile virus case points, (b) population‐weighted control points, and (c) incidence rates of human West Nile virus disease in South Dakota for 2004–2017.

(a) Spatially smoothed West Nile virus case points, (b) population‐weighted control points, and (c) incidence rates of human West Nile virus disease in South Dakota for 2004–2017.