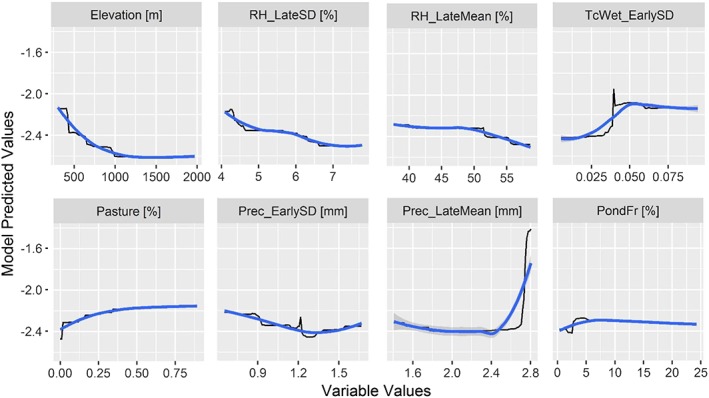
Figure 7.

Boosted regression tree partial dependence of risk on the top ranked environmental variables from the combined model containing all data sources. Black lines represent the fitted function for environmental variables and relative West Nile virus risk. Blue lines represent a smoothed approximation. Variables are explained in Table 2.
