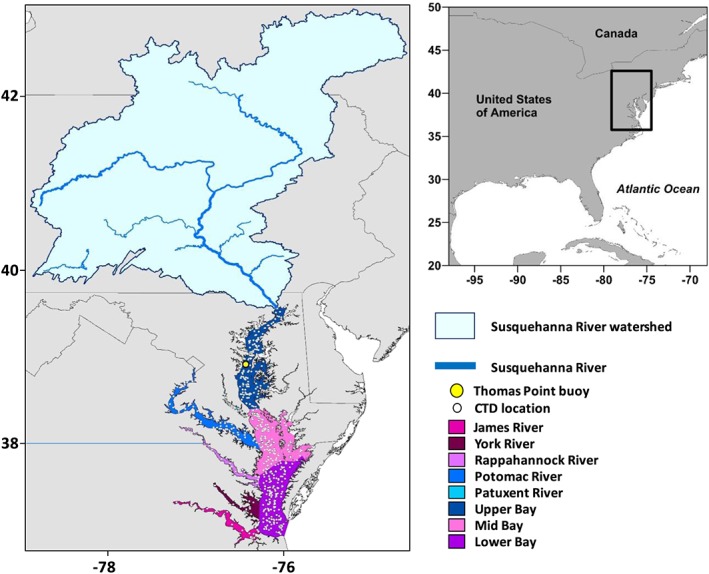
Figure 1.

Study area showing the Susquehanna River watershed, the location of the Thomas Point buoy, and the Chesapeake Bay and major tributaries. CTD cast stations used to develop the statistical framework (Figure 3) are also shown. Colors denote the eight zones of the Bay mentioned in the text.
