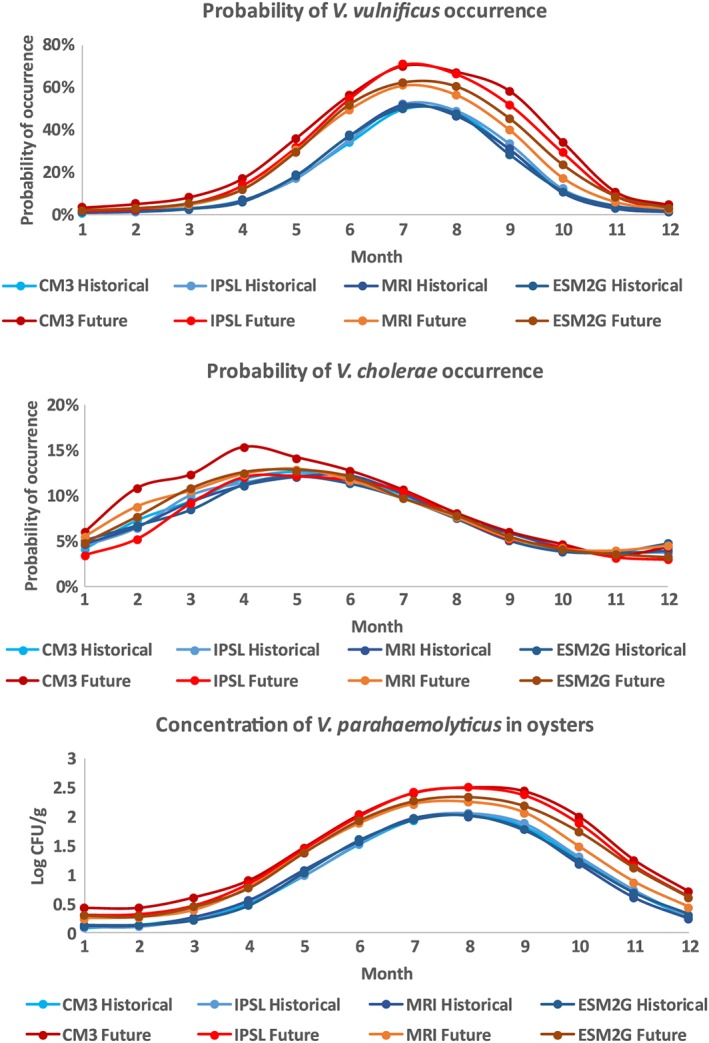
Figure 5.

Mean monthly probability of occurrence for (top) V. vulnificus and (middle) V. cholerae, and predicted mean (bottom) V. parahaemolyticus in oysters, between a historical (1970–1999) and future (2071–2100) time period, across all regions of the Chesapeake Bay. Projections were calculated using the GLMs in Table 1, using four statistically downscaled GCMs.
