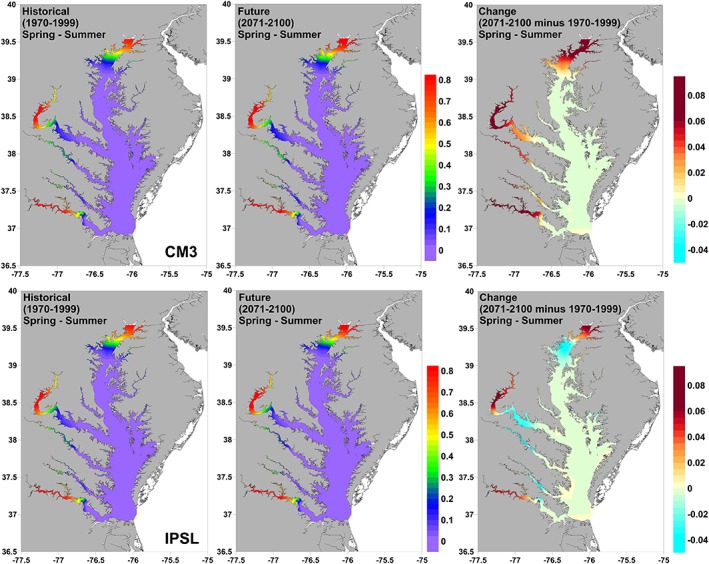
Figure 7.

Projections of historical (1970–1999) and future (2071–2100) probability of spring‐summer (March–September) V. cholerae occurrence in the Chesapeake Bay from two statistically downscaled GCMs (CM3 and IPSL). The change between the two time periods is also shown.
