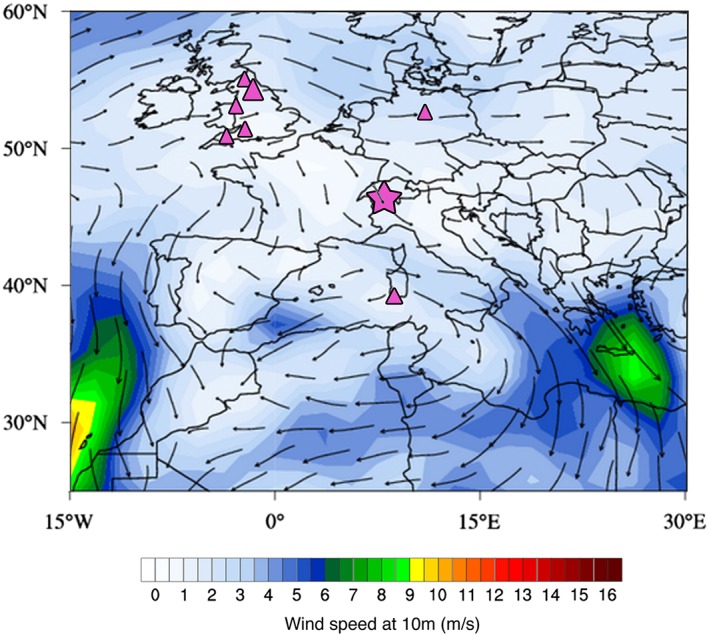
Figure 4.

Summer average atmospheric circulation (wind speed, m/s). NOAA/Cooperative Institute for Research in Environmental Sciences (CIRES) 20th century reanalysis V2, JJA example 1984 is visualized using CCI's web‐based Climate Reanalyzer. The location of CG is highlighted with a star and major Pb/Ag mining centers with triangles 1347–1460 C.E. The size of triangle markers indicates approximate volume of production based on written sources.
