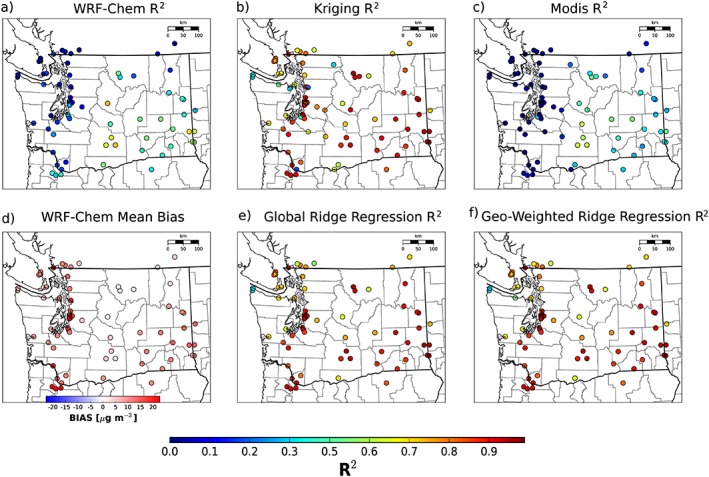
Figure 3.

R 2 value for each in situ measurement site as compared to (a) WRF‐Chem, (b) kriged PM2.5 measurements, (c) MODIS AOD, (e) Global Ridge Regression, and (f) geo‐weighted ridge regression for 1 June 2012–2031 and October 2012. (d) The mean bias for the WRF‐Chem simulated PM2.5 at each in situ measurement site (note the different color scale).
