
Figure 2.
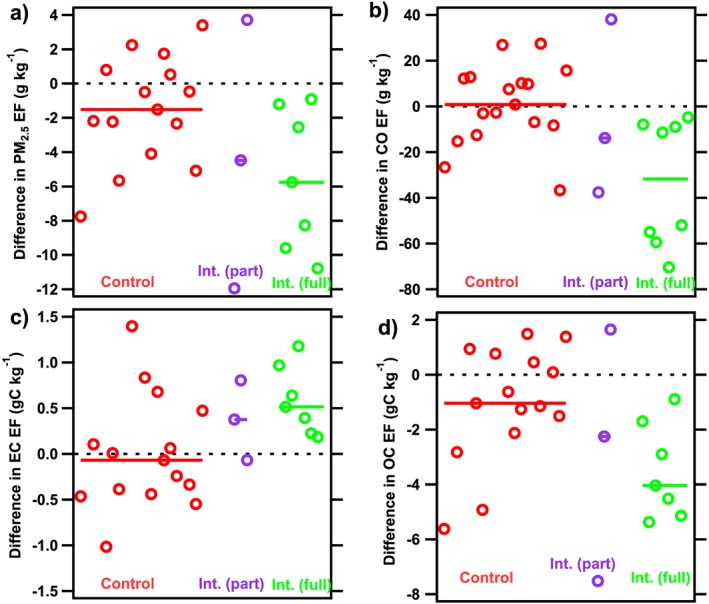
Plots showing the difference (post‐pre) between EFs measured in the same households, separated by group, for (a) PM2.5, (b) CO, (c) EC, and (d) OC. Horizontal spread in points is only to separate individual households; line shows median difference for the group.