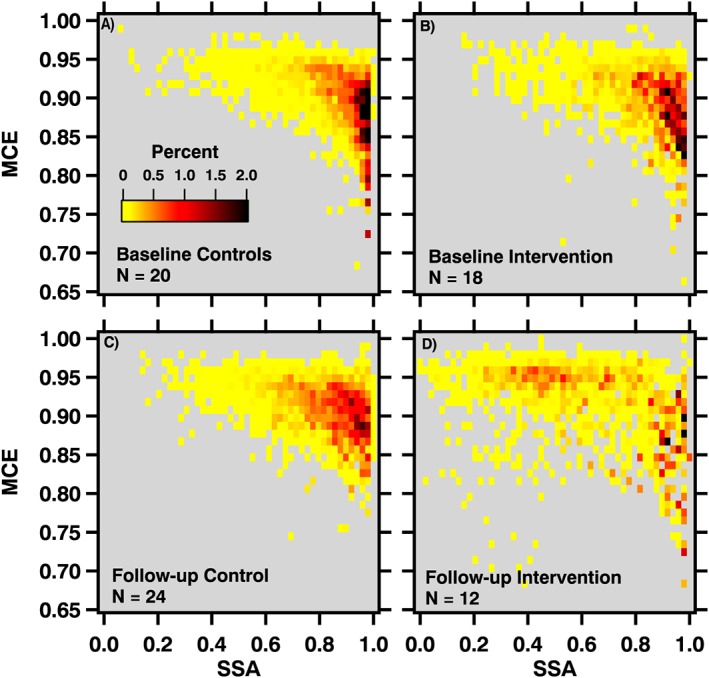
Figure 4.

Bivariate histogram (PaRTED) plots [Chen et al., 2012] showing the distribution of emitted PM (fraction of total aerosol light scattering) as a function of the MCE and SSA at the time of emission. (a) Baseline measurement control, (b) intervention groups, (c) follow‐up measurement control, and (d) “full” intervention groups.
