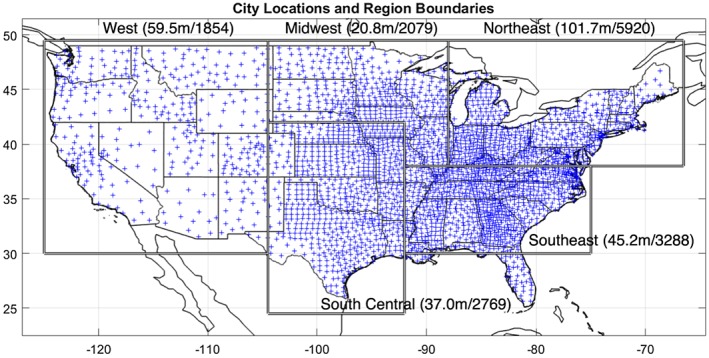
Figure 1.

All five regions (outlined) with summary statistics (total population/number of agencies) and all city locations (blue plus signs). Note that city locations are mapped to the geographic center of their county and that each plus sign may represent multiple agencies.
