
Figure 1.
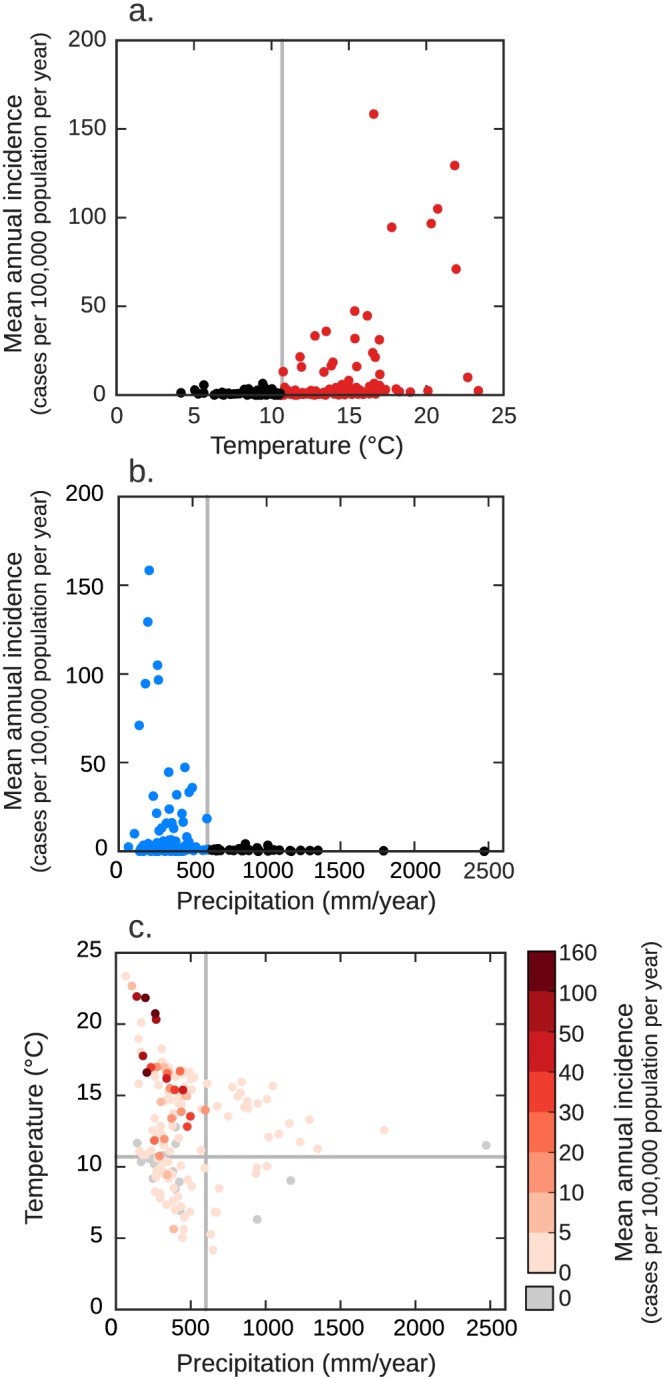
Valley fever incidence for counties in the southwestern United States (n = 152) as a function of (a) mean annual temperature and (b) mean annual precipitation. All counties that have endemic levels of Valley fever incidence (defined as meeting or exceeding 10 or more cases per 100,000 population per year during 2000–2015; n = 23) have a mean annual temperature greater than or equal to 10.7°C and a mean annual precipitation level less than or equal to 600 mm/year. (c) Counties with higher levels of mean annual Valley fever incidence are concurrently hotter and drier. We adapted panels a and b of this figure from Gorris et al. (2018) and added the gray lines to indicate the position of the climate thresholds we used to build our climate‐constrained niche model.