
Figure 3.
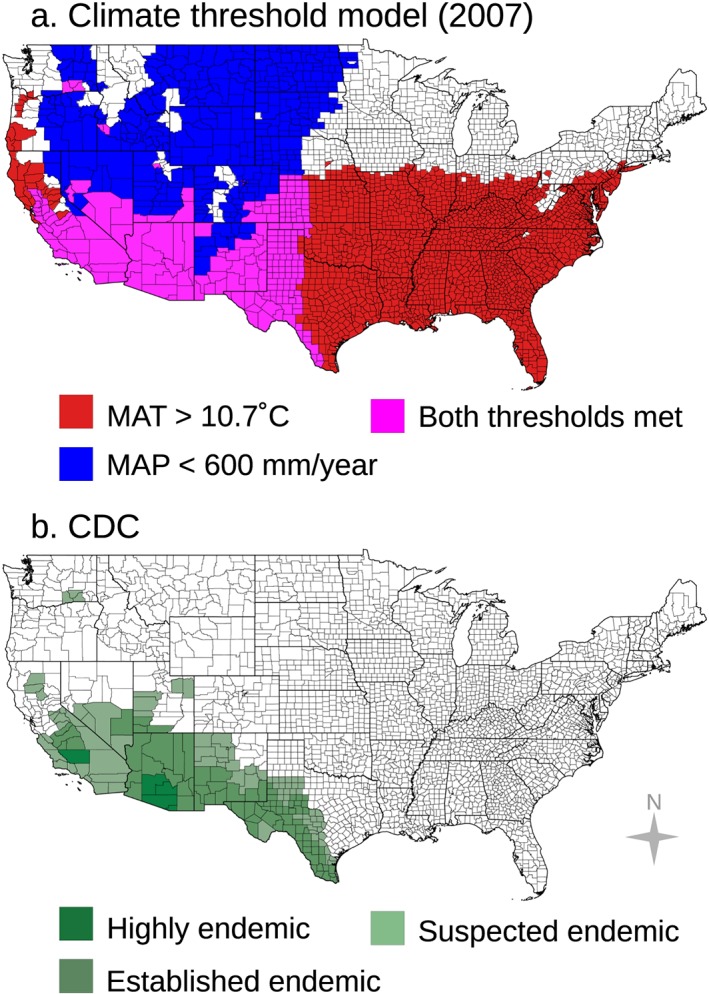
(a) Counties our climate‐constrained niche model identify as endemic (with a mean annual temperature greater than or equal to 10.7°C and a mean annual precipitation level less than or equal to 600 mm/year) are colored in magenta. (b) There is reasonable agreement between this set of counties and the endemic region identified by the CDC. Counties shown in red in panel a have a mean annual temperature greater than or equal to 10.7°C but unsuitable mean annual precipitation (greater than 600 mm/year). Counties shown in blue have a mean annual precipitation level less than or equal to 600 mm/year but unsuitable mean annual temperature (less than 10.7°C). Counties in white our model defines as unsuitable according to both thresholds.