
Figure 4.
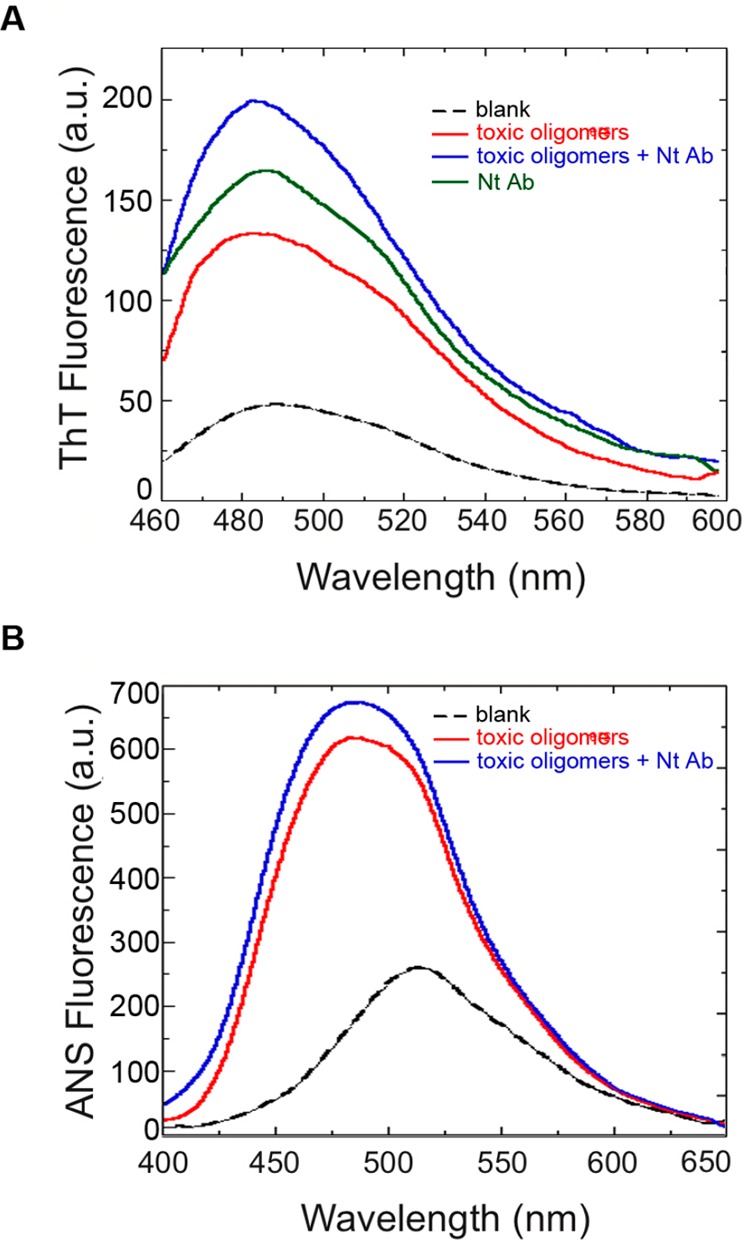
Structural characterization of αS oligomers in the absence and presence of Nt-Ab. (A) ThT fluorescence spectra of αS oligomers (4 μM) incubated in the absence (red) or presence (blue) of a 1:1 molar ratio of Nt-Ab for 15 min before performing the measurement. The ThT fluorescence spectra of free Nt-Ab (green) and without any protein (dashed line) are also shown. Samples were excited at 440 nm, and the emission fluorescence spectra were recorded between 460 and 600 nm. (B) ANS fluorescence spectra of αS oligomers (4 μM) incubated in the absence or presence of a 1:1 molar ratio of Nt-Ab for 15 min before performing the measurement. The ANS fluorescence spectrum without any protein is also shown (dashed line). Samples were excited at 350 nm, and the emission fluorescence spectra were recorded between 400 and 650 nm.