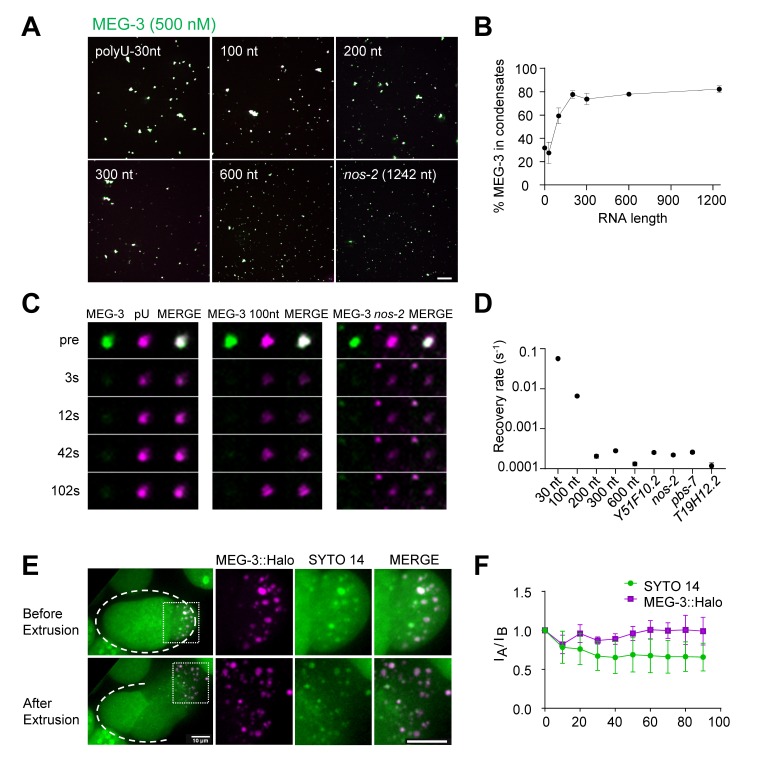
Figure 5. Long RNAs stably associate with the MEG gel phase.
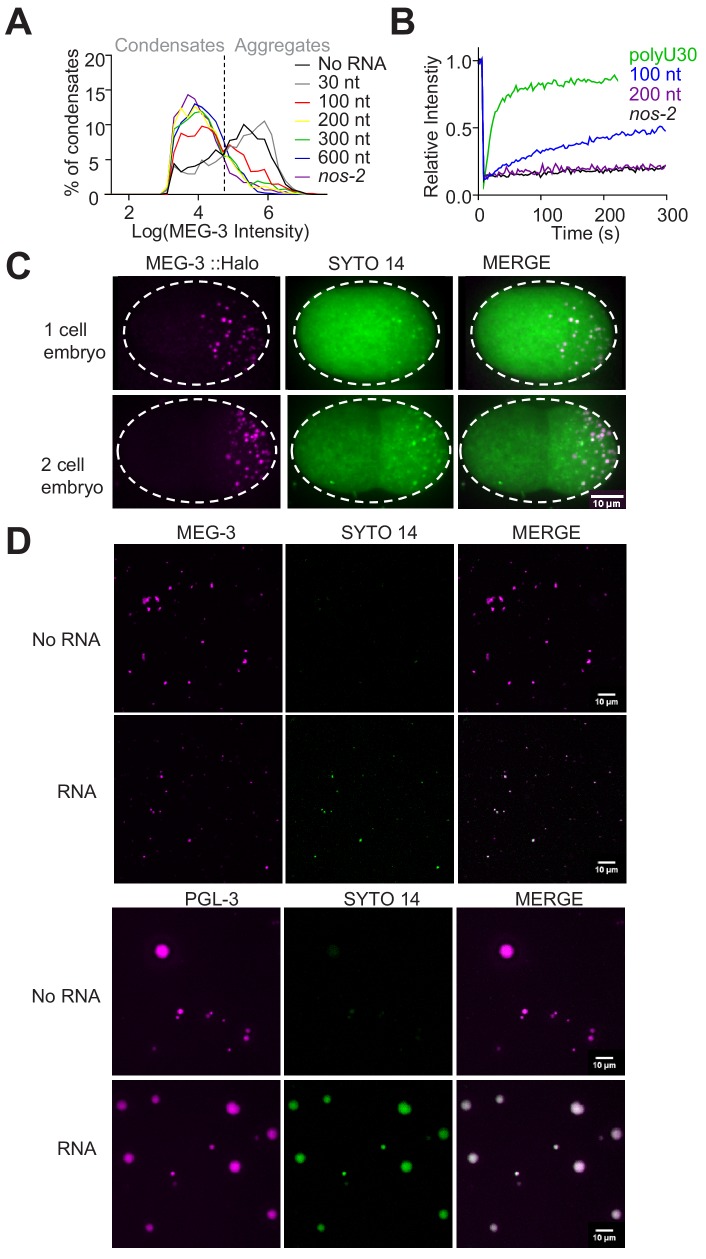
(A) Representative photomicrographs of MEG-3 condensation reactions with indicated RNAs. 100–600 nt RNAs are fragments of nos-2 (Materials and methods). Reactions contained 500 nM MEG-3 and 20 ng/µL RNA, and salt. MEG-3 (green) was trace labeled with Alexa647 and nos-2 RNAs (magenta) were trace labeled with Alexa488 or Alexa546, polyU-30nt was trace labeled with fluorescein (Materials and methods). Scale bar is 20 µm. (B) Percent of MEG-3 in condensates plotted vs. RNA length assembled as in (A). Condensates were defined as objects with a MEG-3 intensity of Log (I) ≤ 4.6 from histograms in Figure 5—figure supplement 1A. Each data set includes condensates from 12 images collected from three experimental replicates. Circles indicate the mean and bars represent the SD. (Materials and methods). (C) Representative images showing fluorescence recovery after partial photobleaching (FRAP) of condensates assembled as in (A) and incubated for 30 min in condensate buffer. (D) Graph showing rates of fluorescence recovery after photobleaching (FRAP) for indicated RNAs in MEG-3 condensates. Values were normalized to initial fluorescence intensity, corrected for photobleaching and plotted. Circles indicate the mean (n > 6) and bars represent the SD. Refer to Figure 5—figure supplement 1B for time traces. (E) Time-lapse photomicrographs of a four-cell embryo expressing MEG-3::Halo and stained with SYTO 14 before and 30 s after laser puncture of the eggshell. MEG-3::Halo and SYTO 14 persist in the granule phase. Scale bar is 10 μm. Quantified in Figure 5F. (F) Graphs showing the fraction of MEG-3::Halo or SYTO 14 retained in the condensate phase after extrusion from embryos normalized to the fraction before extrusion (time 0). Total Halo or SYTO 14 fluorescence in granules was measured before laser puncture (IB) and after laser puncture (IA), corrected for photobleaching and used to calculate a fluorescence ratio (IA/IB). Means are indicated along with error bars representing ± SD calculated from five embryos.


