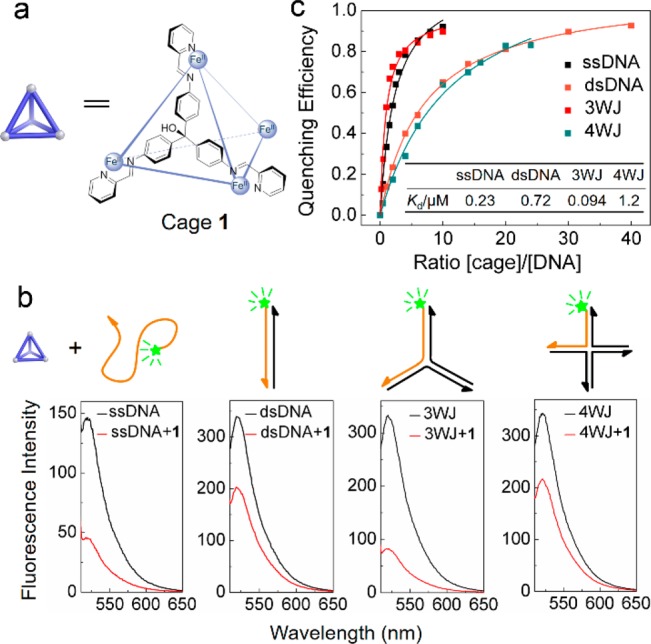
Figure 1.

Fluorescence study of the interaction between cage 1 and different types of DNA. (a) Molecular structure of cage 1; the SO42– counterions are omitted for clarity. (b) Effects of 1 (0.2 μM) on the fluorescence intensity of different DNA structures (0.1 μM) labeled with the FAM fluorophore. (c) Quenching efficiency based on the concentration ratio of cage 1 to the whole DNA structures (0.1 μM). Inset: Kd values for different DNA structures. Further details on data fitting are given in Figure S4. All fluorescence measurements were performed in PBM buffer (10 mM phosphate buffer, 10 mM MgSO4, pH 7.5).
