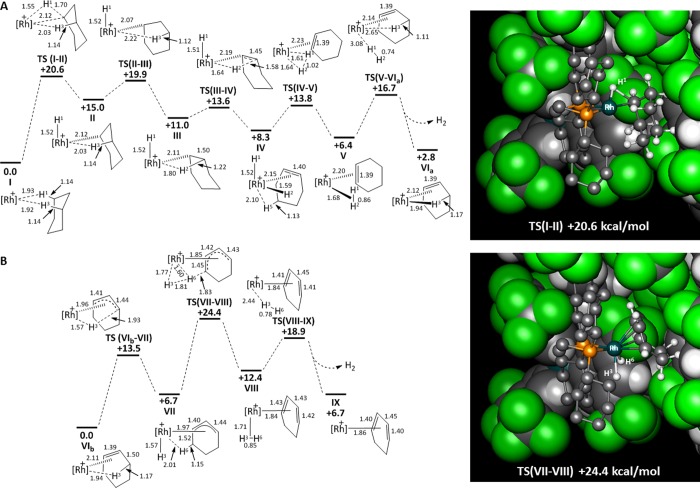
Figure 7.
Free energy profiles (kcal/mol) for the dehydrogenation of (A) cyclohexane at one Rh center within the [1-C6H12][BArF4] unit cell and (B) cyclohexene at one Rh center within the [1-C6H10][BArF4] unit cell. Selected distances (Å) within the reacting Rh cations are shown, where [Rh]+ = [(Cy2P(CH2)2PCy2)Rh]+ and the remaining cell contents are omitted for clarity. Distances to delocalized π-ligands are to the centroid of the carbons involved. Also shown are the computed structures of the rate-limiting transition states for each profile, with the reacting Rh cation (ball and stick mode) set against the nearby unit cell contents (space-filling mode): Rh (teal); P (orange); C (charcoal); H (silver); F (green).

