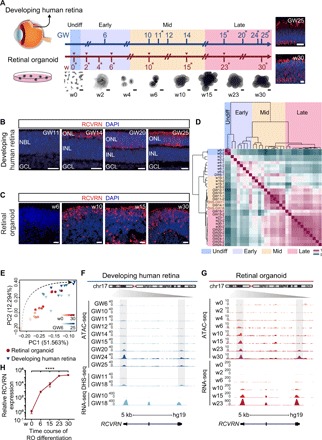
Fig. 1. Landscapes of chromatin accessibility in the developing human retina and RO.

(A) Schematic illustration of the overall experimental designs. Whole human neural retinae and ROs were collected for ATAC-seq (two replicates labeled with asterisk) and RNA-seq (inverted triangle). Development of human retinae and ROs was grouped into early, middle, and late stages and color coded. Immunostaining of GNAT1 in human retinae GW25 and ROs w30 is shown. Nuclei were stained with 4′,6-diamidino-2-phenylindole (DAPI). Undiff, undifferentiated; Early, early developmental stage; Mid, middle developmental stage; Late, late developmental stage. Scale bars, 500 μm (bright-field images) and 10 μm (fluorescence images). PC1, principal component 1; PC2, principal component 2. (B and C) Immunostaining of RCVRN in human retinae (B) and ROs (C). Nuclei were stained with DAPI. NBL, neuroblastic layer; ONL, outer nuclear layer; INL, inner nuclear layer; GCL, ganglion cell layer. Scale bars, 20 μm. (D) Heat map of Pearson correlations across all samples using all ATAC-seq peak signals. Relevant developmental stages are labeled with distinct colors as in (A). (E) PCA of chromatin accessibility during human retinal (blue) and RO (red) development in two dimensions. The black dotted arrow indicates the development process of retinogenesis. (F and G) Normalized epigenetic and expression profiles at the RCVRN loci during human retinal development (F) and RO differentiation (G). All signals were obtained from the University of California, Santa Cruz (UCSC) genome browser. (H) qRT-PCR analysis of the expression level of RCVRN (n = 3) during RO differentiation. Data are means ± SEM. One-way analysis of variance (ANOVA) was performed. ****P < 0.0001.
