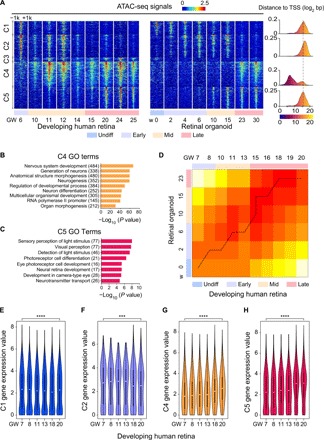
Fig. 2. Epigenetic signatures and expression map of developing human retina and RO.

(A) Heat map of 10,563 differential regulatory elements during human retinal and RO development. Each column is a sample, and each row is a peak. Color scale shows the relative ATAC-seq peak intensity centered at the summit of each peak. Distance of cluster peaks to their nearest gene promoters is shown on the right. (B and C) Significant GO terms enriched in C4 (B) and C5 (C) cluster peaks using GREAT v3.0.0. The number of genes enriched in GO terms is shown in the parentheses. (D) Comparison of open-ended DTW analysis between human retinae and ROs. There were 3235 DEGs in humans. Gene expression data were subjected to open-ended DTW analysis, with results plotted as a heat map. (E to H) Violin plot representing the expression level of genes closest to the top 1000 peaks in C1 (E), C2 (F), C4 (G), and C5 (H) during human retinal development showing a variable but positive correlation between chromatin accessibility and gene expression. GREAT was used to annotate peaks to genes. Statistical significance was analyzed with one-way ANOVA. ***P < 0.001, ****P < 0.0001.
