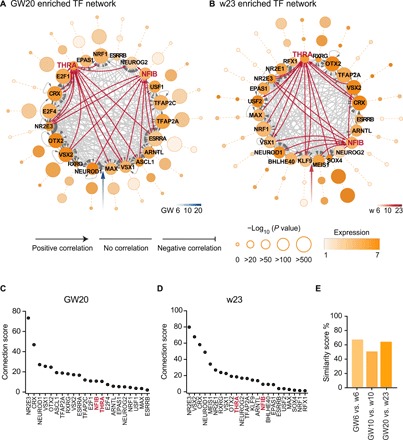
Fig. 5. Dynamics of transcriptional regulatory network in developing human retina and RO.

(A and B) Cis-regulatory networks of TFs (nodes) in human retinae GW20 (A) and ROs w23 (B). Circle groups from inner to outer represent different time points. Arrow on edge from node X to node Y indicates that TF-X regulates TF-Y by binding to the promoter site of the latter. Size of each node indicates TF enrichment, and color of each node indicates TF expression levels in that stage. Connection types indicate Pearson correlation between gene expression profiles of connected TFs. (C and D) Ranking of the connection score in human retinae GW20 (C) and ROs w23 (D) networks. The connection score of each node was defined as SD of its expression multiplied by its degree. (E) Similarity of human retinal and RO networks in different developmental stages. We selected GW6/w6, GW10/w10, and GW20/w23 to represent the early, middle, and late stages of retinal development and calculated their similarity score, respectively.
