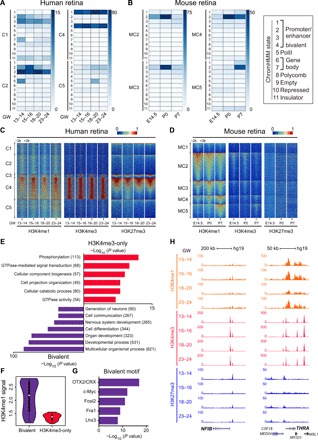
Fig. 6. Cross epigenetic analysis of human and murine retinal development.

(A and B) Heat map of different ChromHMM state enrichment in each cluster during human (A) and murine (B) retinal development. Each column is a sample, and each row is a ChromHMM state. Color scale shows the relative enrichment. Each state is used to represent the ChromHMM states (rectangle on the right). (C and D) Heat map of H3K4me1, H3K4me3, and H3K27me3 signals for differential regulatory elements in each cluster during human (C) and murine (D) retinal development. Each column is a sample, and each row is a peak region. Color scale shows the relative ChIP-seq peak intensity centered at the summit of each peak. (E) Significant GO terms enriched in bivalent subgroup and H4K4me3-only subgroup peaks using GREAT v3.0.0. The number of genes enriched in GO terms is shown in the parentheses. (F) Violin plot representing H3K4me1 ChIP-seq peak intensity in bivalent subgroup peaks and H4K4me3 subgroup peaks. (G) TF motifs enriched in bivalent subgroup peaks, with P values estimated from HOMER v4.8. (H) Normalized H3K4me3 and H3K27me3 profiles at NFIB and THRA loci during human retinal development. All signals were obtained from the UCSC genome browser.
