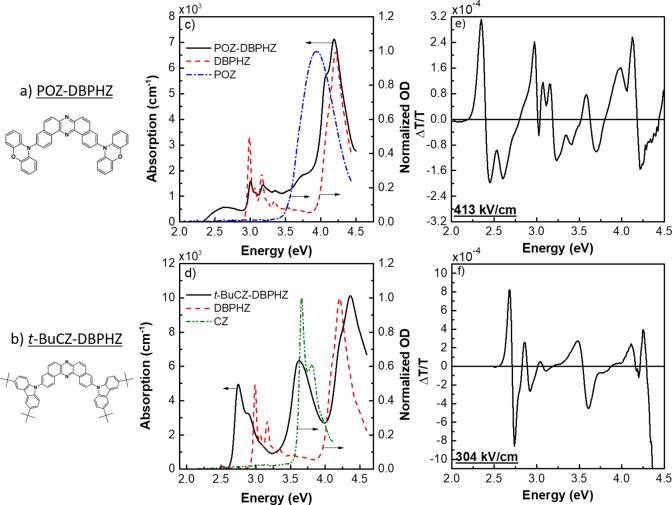
Figure 1.
Electroabsorption (EA) spectroscopy of two structurally similar emitters with diverging TADF properties: (a) POZ-DBPHZ and (b) t-BuCZ-DBPHZ. The absorption coefficients are shown in panels c and d for each emitter and overlapped with the absorption of the DBPHZ core (red dashed line), POZ (blue dotted–dashed line), and Carbazole (Cz, green dotted–dotted–dashed line). Finally, the EA spectra at (e) 95 V and (f) 70 V are also shown. It is worth mentioning the difference in scales as they are different between the two materials. Measurements collected in emitter-in-zeonex blends with a layer thickness of 2.3 μm, determined with a profilometer.

