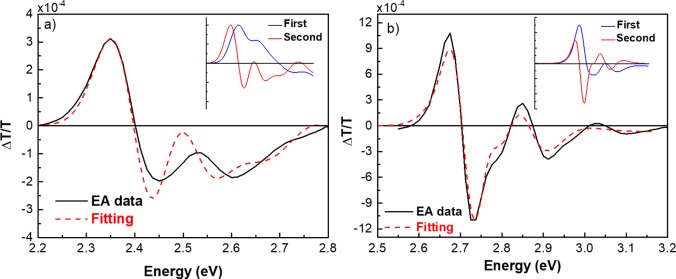
Figure 2.
Low-energy electroabsorption band (solid black line) spectra of (a) POZ-DBPHZ and (b) t-BuCZ-DBPHZ overlapped with the fitting (dashed red line). For comparison, the insets of both figures show the first and second derivatives of the lowest-energy absorption bands calculated from the Gaussian reconstruction (Figure S2).27

