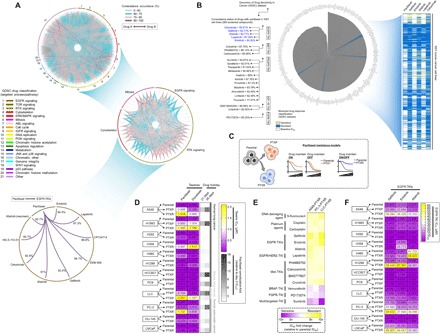
Fig. 1. Paclitaxel resistance primes selection trajectories of cancer cells to EGFR-targeted therapies.

(A) Circos plot visualization of coresistance signatures of 265 drugs screened in 1001 human cancer cell lines processed from the publicly available database of the GDSC. Drugs were classified according to their main target mode of action. Note that coresistance is viewed as either co-occurring bidirectional or one-directional event as identified in the preprocessed data files of binarized response of cell lines to drugs in the GDSC. RTK, receptor tyrosine kinase; MAPK, mitogen-activated protein kinase; JNK, c-Jun N-terminal kinase; IGFR, insulin-like growth factor receptor. (B) Radial histogram plot visualization of correlated drugs ranked on the basis of their coresistance classification with paclitaxel resistance derived from their sensitivity response in the panel of cell lines tested in the GDSC datase (left). Discretization threshold of binarized drug response (sensitive or resistant) of paclitaxel and EGFR-TKIs gefitinib, erlotinib, afatinib, lapatinib, and cetuximab (right). (C) Cellular models of paclitaxel resistance used in this study. (D) Characterization of acquired primary paclitaxel and collateral docetaxel resistance in a panel of PTXP (6 cell lines), PTXR (10 cell lines), and their parental lines derived from human and mouse lung and human pancreatic cancers. Stability of resistance was assayed using 21- and 35-day drug holidays. Cells were treated with or without drugs for 72 hours with a concentration dilution series and were assayed for sulforhodamine B (SRB). Representative of three independent experiments. (E) Validation screening of collateral resistance evaluated in a panel of PTXR cell lines with selected drugs representing chemically different classes (selected from a pool of drugs with >80% coresistance classification with paclitaxel) in two PTXR cell lines with the highest resistance (A549-PTXR and PC-3–PTXR). Resistance was assessed on the basis of IC50 fold change relative to parental cell lines assayed as in (D). (F) Characterization of collateral EGFR-TKI (gefitinib, erlotinib, and afatinib) resistance in the same panel of cell lines and assay as in (D). Representative of three independent experiments.
