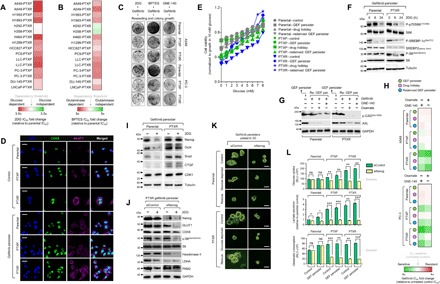
Fig. 4. Stemness is functionally associated with a glycolytic metabolism in EGFR-TKI persisters derived from paclitaxel-resistant cancer cells.

(A and B) Characterization of glycolysis and glutaminolysis dependency of indicated PTXP and PTXR cell lines upon treatment with or without 2DG or BPTES with a concentration dilution series and assayed for SRB (means ± SD of three biological replicates). (C) Colony formation assay of parental, PTXP, and PTXR derived from A549 and PC-3 cells following indicated drug treatment regimes (10 mM 2DG, 10 μM BPTES, or 8 μM GNE-140 for 24 hours, followed by 5 μM gefitinib for 72 hours and then equally reseeded in drug-free media following 8 days of culture). Representative of two independent experiments. (D) Representative images of immunofluorescence of CDK8 (green) and GLUT1 (magenta) in indicated A549-derived control and GPs. Nuclei are shown in blue [4′,6-diamidino-2-phenylindole (DAPI)]. Scale bars, 25 μm. Representative of two independent experiments. (E) Glucose titration curves for indicated A549-derived GPs. Values were normalized to growth in 10 mM glucose-containing media (0 mM glucose represents glucose-deprived media; means ± SD of two biological replicates). (F) Western blot analysis of indicated proteins in the mTOR/AMPK pathway in A549-derived GPs upon treatment with or without 10 mM 2DG for indicated times. Tubulin was used as a loading control. Representative of two independent experiments. (G) Western blot analysis of phospho-CAD (Ser1859) [p-CAD(Ser1859)] and AXL expressions in indicated A549-derived GPs upon treatment with or without LDHA inhibitors GNE-140 (8 μM) or oxamate (40 mM) for 24 hours, followed by treatment with or without 5 μM gefitinib for 24 hours. Tubulin was used as a loading control. Representative of two independent experiments. (H) Sensitivity characterization of indicated A549- and PC-3–derived GPs upon treatment with or without 8 μM GNE-140 or 40 mM oxamate, followed by treatment with gefitinib for 72 hours with a concentration dilution series and assayed for SRB (means ± SD of three biological replicates). (I and J) Western blot analysis of indicated stemness and glycolysis marker expressions in indicated A549-derived GPs upon treatment with or without 10 mM 2DG for 24 hours. A549-PTXR GPs underwent NANOG RNAi for 48 hours, followed by the same 2DG treatment. Tubulin and GAPDH were used as loading controls. Representative of two independent experiments. (K) Phase-contrast images of indicated A549-derived GP 3D cell spheres upon NANOG RNAi for 48 hours, followed by indicated glucose modifications for 12 hours (rescue indicates culture in 10 mM glucose–containing media). Representative of two independent experiments. Scale bars, 70 μm. (L) Glucose uptake, lactate secretion, and glutamate consumption measurements in indicated A549-derived GPs upon NANOG RNAi for 48 hours (RLU, relative luciferase units; means ± SD of three biological replicates; ns, not significant, *P < 0.05, **P < 0.01, ***P < 0.005, Student’s t test).
