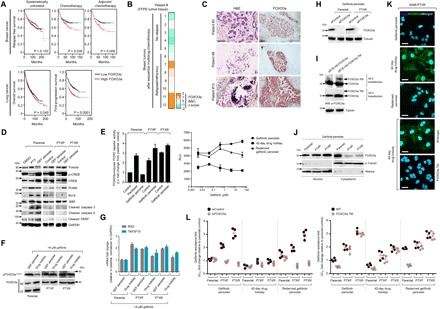
Fig. 6. Apoptosis evasion by FOXO3a is crucial to initiate and maintain phenotypic transitions to a stable secondary resistance.

(A) Kaplan-Meier plots of RFS of patients with breast cancer, categorized in cohort groups of systemically untreated, chemotherapy-treated, and adjuvant chemotherapy–treated patients (top) and overall and first progression survival of patients with lung cancer (bottom). Patient survival data were stratified by FOXO3a expression (low or high) in their primary tumors. P values were calculated using a log-rank test. (B) qRT-PCR analysis of FOXO3a expression in FFPE tumor tissue sections from patients with breast cancer who underwent sequential multidrug chemotherapy. Log-transformed gene expression values are relative to the sample with the lowest FOXO3a expression and were normalized to GAPDH levels (means ± SD of two biological replicates). (C) Immunohistochemical analysis of indicated FFPE tumor tissue sections used in (B). Sections were blocked and probed with FOXO3a antibody and detected using a 3,3’-Diaminobenzidine (DAB) chromagen kit (right). Replicate tissue sections were stained with hematoxylin and eosin (H&E) (left). All sections were photographed with an inverted phase-contrast microscope (original magnification, ×200). Scale bars, 150 μm. Representative of two independent experiments. (D) Western blot analysis of indicated apoptotic signal expressions in A549-derived parental, PTXP, PTXR, and indicated GPs. Treatment with 20 nM paclitaxel for 24 hours in parental cells served as a positive control. GAPDH was used as a loading control. Representative of two independent experiments. PARP, poly(adenosine 5´-diphosphate–ribose) polymerase. (E) FOXO reporter activity induced by FOXO3 in the same cells and conditions as in (D). Values represent ratio fold induction normalized reporter activity in the presence of FOXO3 to that in the presence of the negative control expression vector (transfected for 48 hours); all relative to parental control. Reporter activity was measured upon treatment with indicated concentration dilution series of gefitinib for 72 hours in indicated A549-PTXR GPs before plasmid transfections for 48 hours (right; means ± SD of three biological replicates). LU, luciferase units. (F) Western blot analysis of phospho-FOXO3a (T32) expression in indicated A549-derived persisters upon treatment with 8 μM gefitinib for 72 hours. Representative of two independent experiments. SE, short exposure; LE, long exposure. (G) qRT-PCR analysis of expression of FOXO3a target genes IRS2 and TNFSF10 in the same cells and treatment as in (E). Values are relative to parental and were normalized to GAPDH levels (means ± SD of three biological replicates). (H) Western blot analysis of FOXO3a expression in indicated A549-derived GPs upon FOXO3a RNAi for 48 hours. Tubulin was used as a loading control. Representative of two independent experiments. (I) Western blot analysis of active FOXO3a expression in A549-PTXR GPs upon transfection with indicated plasmids for 36 hours to induce transcription of an active mutant form of FOXO3a [hemagglutinin (HA)–tagged FOXO3a.TM]. Tubulin was used as a loading control. Representative of two independent experiments. (J and K) Characterization of FOXO3a translocation in indicated A549-derived GPs by Western blotting (J) (α-tubulin and histone were used as loading controls for nuclear and cytoplasmic lysates, respectively) and immunofluorescence (K) (cells were transfected with or without HA-tagged FOXO3a.TM for 36 hours). Representative of two independent experiments. (L) Gefitinib resistance characterization of indicated A549-derived GPs upon FOXO3a RNAi for 48 hours or transfection with control or HA-tagged FOXO3a.TM plasmid for 36 hours following gefitinib treatment for 72 hours with a concentration dilution series and were assayed for SRB. Values are relative to parental control (means ± SD of four biological replicates).
