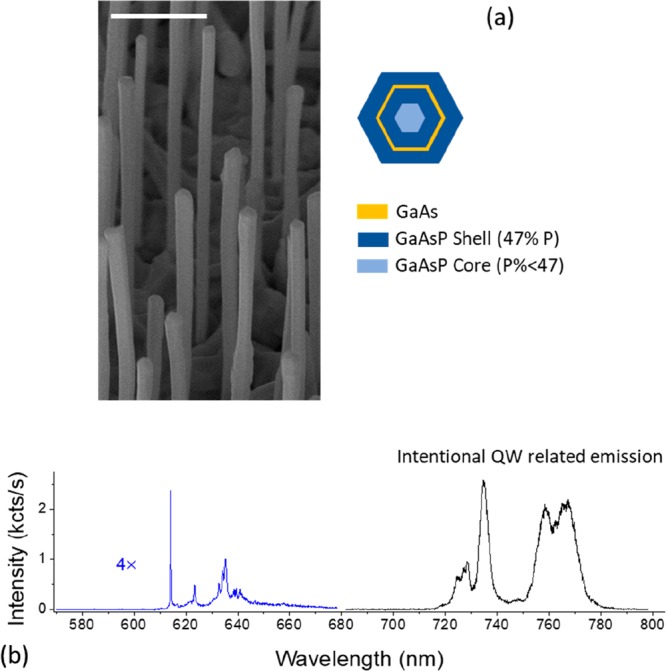
Figure 1.

(a) SEM image of the nanowires with the inset showing a schematic of the intended cross-section. Scale bar is 1 μm. (b) A single nanowire PL spectrum obtained at 6 K. Sharp, less intense peaks are observed in the 610–650 nm wavelength region and the intentional QW emission is visible in the 720–780 nm range.
