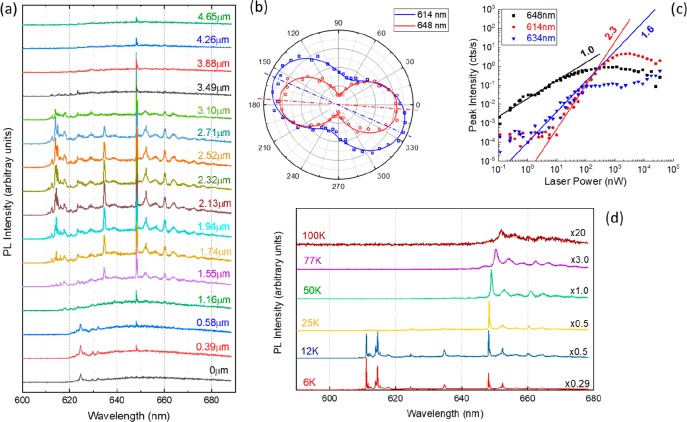
Figure 5.
(a) μ-PL spectra recorded for different positions along the axis of a nanowire for a laser power of 50 nW. Distances are given with respect to the base. (b) Polarization plots for two of the sharp emission lines from panel a. The axis of the nanowire is horizontal, and the axis of the preferred polarization is indicated by the dashed lines in respective colors. (c) Log scale plot of the power dependent intensity of three of the sharp emission lines. (d) μ-PL spectra as a function of the sample temperature. The numbers on the right-hand side give the multiplication factor for each spectrum.

