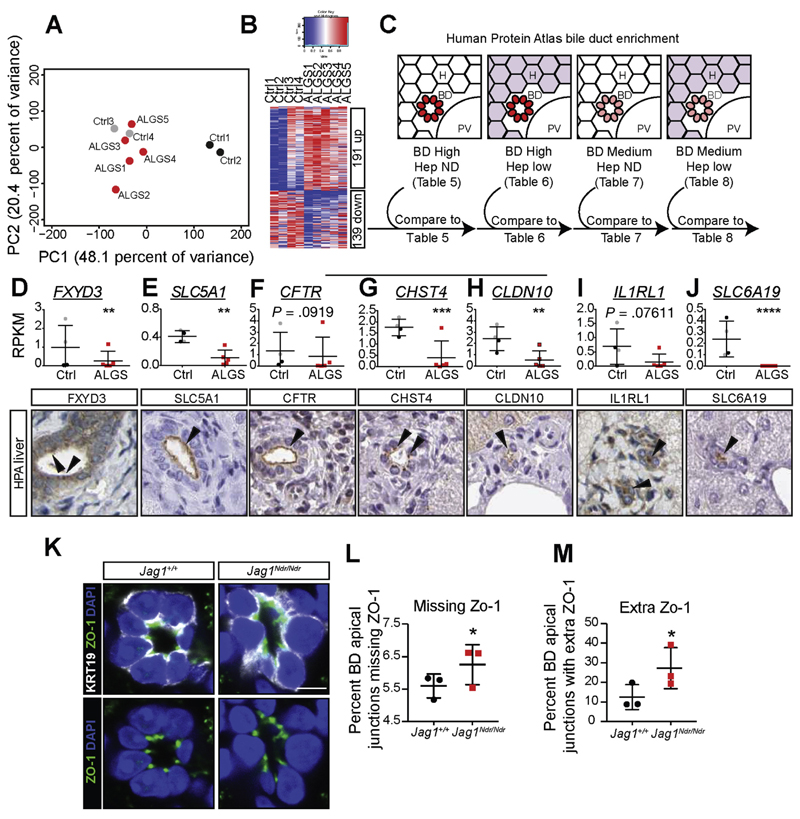
Figure 4.
RNA sequencing of ALGS liver reveals a specific decrease in apical markers of biliary cells. (A) Principle component analysis (PCA) of RNA sequencing of liver biopsies from patients with ALGS or control patients. A comparison with non-cholestatic control samples (Ctrl 1 and 2) and with cholestatic control samples (Ctrl 3 and 4) shows that ALGS samples cluster with cholestatic liver samples. (B) Heatmap shows 191 significantly up-regulated and 139 down-regulated genes in ALGS samples. (C) Dysregulated genes were compared with protein lists generated using the HPA (www.proteinatlas.org)18 for genes with high/medium protein expression in biliary cells, and undetected/low expression in hepatocytes (Supplementary Tables 5–8). This pipeline identified transcripts whose proteins were highly enriched at the apical side of bile ducts, including (D) FXYD3, and (E) SLC5A1. Manual comparison of the top 30 down-regulated genes in ALGS further revealed apically enriched proteins: (F) CFTR, (G) CHST4, (H) CLDN10, (I) IL1RL1, and (J) SLC6A19. (K) TJP1/ZO-1 is not down-regulated but is aberrantly localized, with some junctions (L) missing ZO-1, and other cell junctions with (M) extra ZO1 punctae. Error bars indicate s.d.; **corrected P-value (False Discovery Rate) <.01, ***False Discovery Rate <.001, ****False Discovery Rate <10 -7. Scale bar: 5 μm.

