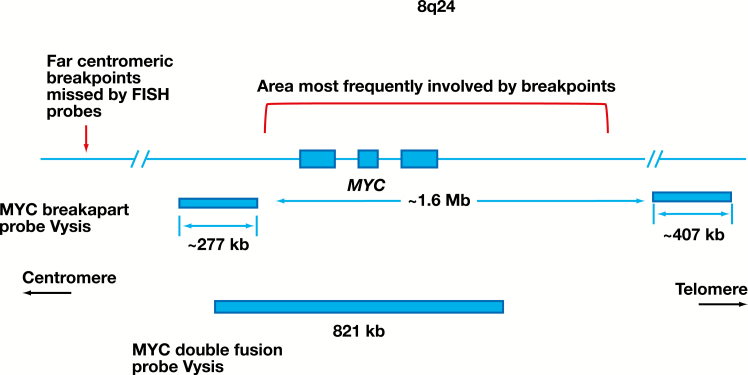
Figure 2.
Schematic diagram of the distribution of most frequent breakpoints involving the MYC gene. The covered regions by break-apart and dual-fusion MYC FISH probes are shown. The region where most of the IGH-MYC breakpoints occur is indicated.12-15 Note the lack of coverage for both probe sets at the far centromeric portion of the MYC gene.

