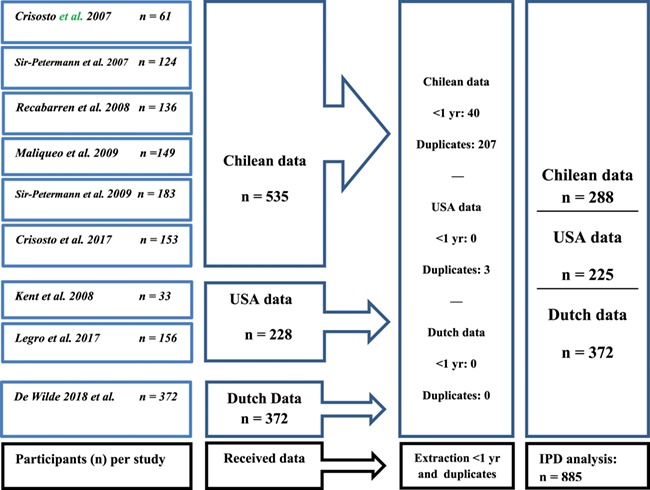
Figure 2. Flowchart of the study: from systematic search results to IPD dataset. This flowchart represents the four steps (four columns’ from left to right), which were undertaken to collect our final data for the IPD meta-analysis. Column (1) Participants (n) per study. Our screening resulted in nine publications from three research groups with (n) participants per article (cases and controls together). Column (2) Received data. Each research group shared one file with all offspring of women with PCOS (OPCOS) and all healthy controls (n), which showed that some subjects participated in more than one publication. Column (3) Extraction <1 yr (year) and duplicates. In the third step, we excluded all children below 1 year old and all duplicate children (children who were screened multiple times). Column (4) IPD analysis n = 885. In the fourth step, a dataset remained with 885 unique children aged 1–18 years (OPCOS and controls), on which we conducted our IPD meta-analyses.

