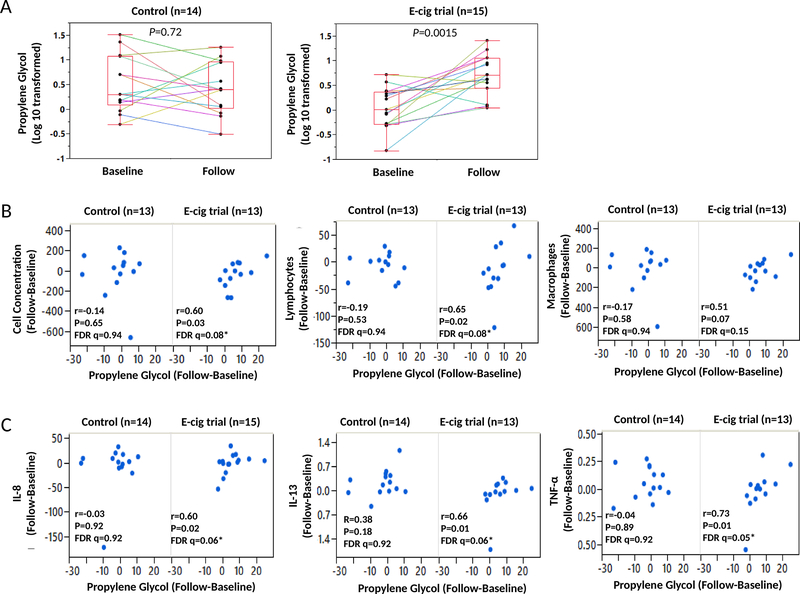
Figure 1. Urine propylene glycol (PG) inflammation over one month intervention.
(A) Log10 transformed levels for PG in urine samples at baseline and follow-up for the control (left) and e-cig intervention (right) groups. Each dot represents one subject and paired assays for baseline and after the intervention are connected by a line. The box plot uses the median and the lower and upper quartiles (25th and 75th). (B-C) Spearman correlations of change (follow up-baseline) between PG and cell concentration, macrophages, and lymphocytes (B), and between PG and cytokines including IL-8, IL-13, and TNF-α (C) are shown in the control (left) and e-cig trial (right) groups. Significant False Positive Rate (FDR) q-values at the 0.1 level indicated by asterisks. Changes in PG and on the x-axis and change in cells (B) and cytokines (C) are on the y-axis. Note: One subject with very high baseline and follow-up PG level (likely a dietary source) was removed for analyses for changes of cells and cytokines. Subjects with red blood cell contamination were removed from the cell count analysis. In the e-cig use group, IL-13 and TNF-α were not detected at follow-up in two subjects.

