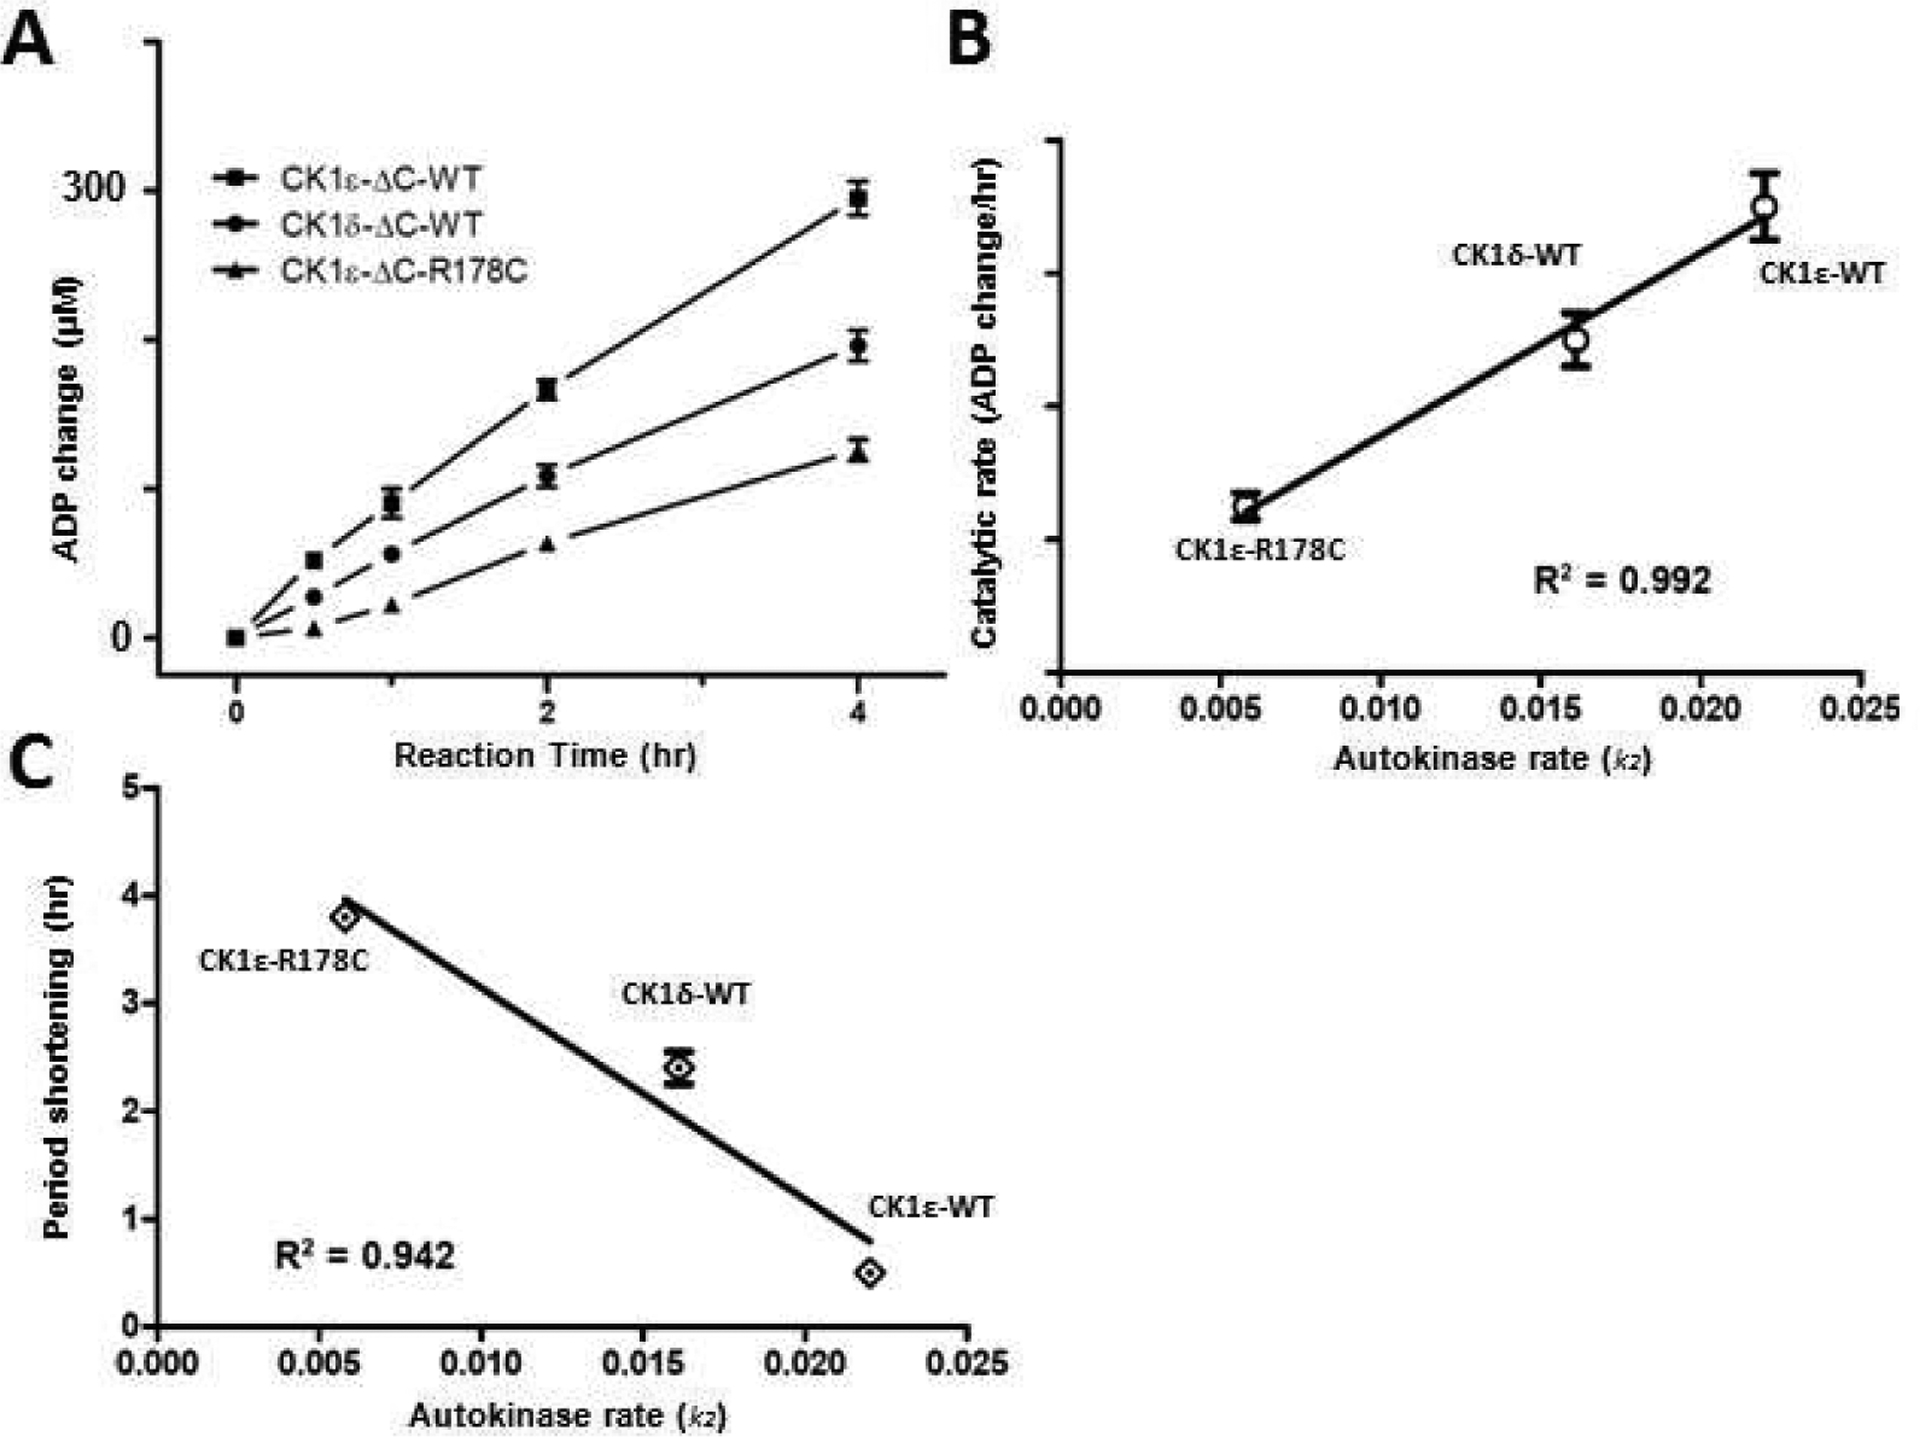
Figure 4. Lowest auto-phosphorylation rates correlate with the largest circadian period shortening.

(A) Rate of conversion of ATP to ADP as measured by UPLC for CK1ε-ΔC (squares), CK1ε-ΔC-R178C (triangles), and CK1δ-ΔC(circles). (B) The catalytic rates of ΔC domains of CK1s derived from the UPLC results correlate with the autokinase rates of full-length CK1s that were derived from Figures 2, S2, and S3. (C) Correlation analysis between the circadian period shortening(see Table 1) and the auto-kinase activity of the different CK1s (Figures 2, 4C–D, S2, and S3). Error bars are +/− standard deviation (from three or more independent experiments).
