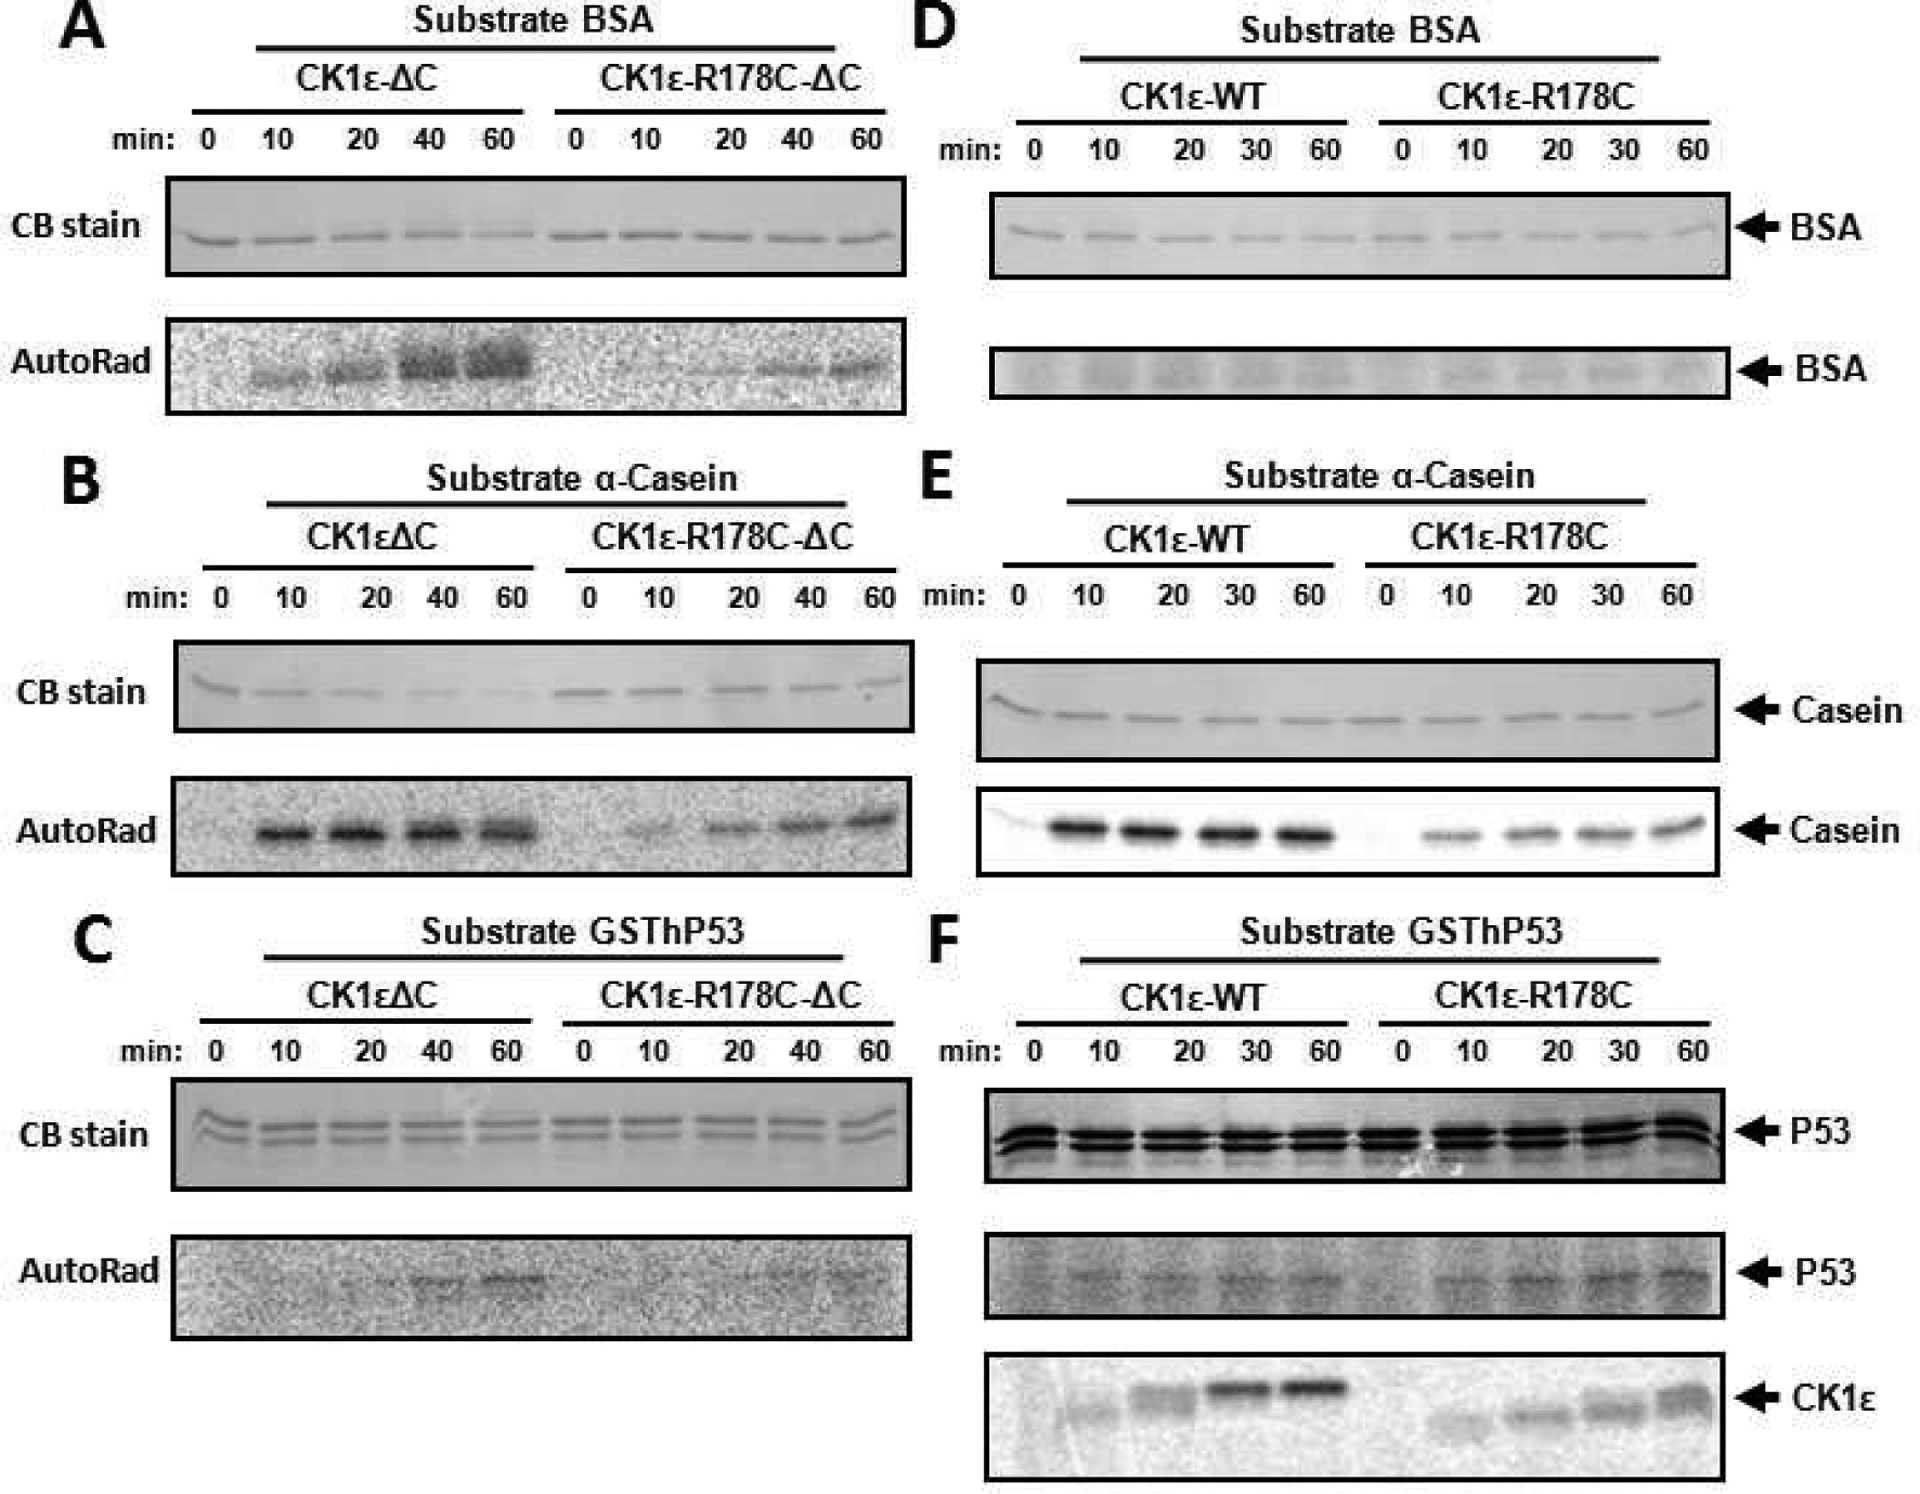
Figure 5. In vitro kinase assay comparing CK1ε-ΔC vs. R178C-ΔC and CK1ε-WT vs. CK1ε-R178C.

Radioactive in vitro kinase assay was performed to assess the change caused by the R178C mutation of CK1ε on different substrates. Compared to native CK1ε-ΔC, the R178C mutation reduced catalytic activity towards BSA (A), α-Casein (B), and hP53 (C). To compare with the activity of the catalytic domains (ΔC) illustrated in panels A-C, full-length CK1ε and CK1ε-R178C kinases were applied to the same substrates with the in vitro radioactive kinase assay in panels D-E: (D) BSA, (E) α-Casein, and (F) hP53. “CB stain” indicates the Coomassie Blue staining to assess the abundance of the proteins in the SDS-PAGE gels (left side). The phosphorylation of each substrate is indicated by P-32 incorporation (“AutoRad,” left side). Arrows point out each substrate (right side). The bottom of panel F adds an auto-phosphorylation time course of full-length CK1ε and CK1ε-R178C; note that native CK1ε-WT auto-phosphorylates itself faster than does CK1ε-R178C.
