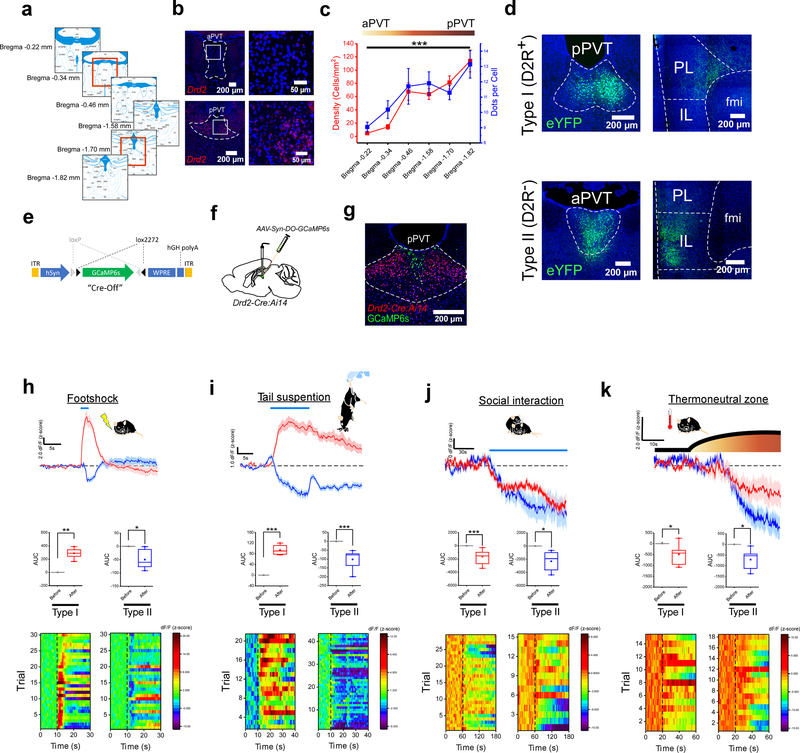
Figure 1. Functionally distinct cell types exist across the antero-posterior axis of the PVT.
a. Schematic of the antero-posterior spread of the PVT in the adult mouse brain and the Bregma locations included in our analyses of Drd2 expression. Red squares depict the Bregma locations of the representative images shown in b for aPVT and pPVT. b. Fluorescent in situ hybridization experiment showing the expression of the Drd2 gene in the aPVT (top) and the pPVT (bottom). c. Quantification of the cellular density (red) and relative expression levels (blue) of Drd2 mRNA across the antero-posterior axis of the PVT. n = 5 mice, F(5,21) = 19.64, one-way ANOVA followed by Tukey’s test. Group comparisons: Bregma −0.22 vs Bregma −1.82, ***P=0.000007. d. Representative images showing the distribution of axonal projections from D2R+ (top panels) and D2R− (bottom panels) neurons of the PVT in the mPFC (data from 3 mice). e. Diagram of the vector used to target expression of the genetically-encoded Ca2+ sensor GCaMP6s to D2R− neurons of the PVT. f. Schematic of the stereotaxic injection to selectively target expression of GCaMP6s to D2R− neurons of the PVT. g. Representative image showing expression of GCaMP6s in D2R− neurons of the PVT of Drd2-Cre:Ai14 mice. h. Top: average GCaMP6s responses to footshocks from both Type I (red) and Type II neurons (blue) of the PVT (n = 7 mice). Footshock duration depicted by the blue line above the trace. Middle: quantification of GCaMP6s responses to footshocks (shown as z-score of dF/F). Area under the curve (AUC), Type I: Before, −0.27 ± 0.25; After, 302.5 ± 46.03, n = 7 mice, **P=0.0012, two-sided Paired sample t-test; Type II: Before, 0.10 ± 0.13; After, −50.05 ± 14.95, n = 6 mice, *P=0.02, two-sided Paired sample t-test. Bottom: heatmap of dF/F for all individual trials. i. Top: average GCaMP6s responses to tail suspension from both Type I (red) and Type II neurons (blue) of the PVT (n = 8 mice). The duration of the tail suspension bouts is depicted by the blue line above the trace. Middle: quantification of GCaMP6s responses to tail suspension. AUC, Type I: Before, 0.012 ± 0.01; After, 94.25 ± 10.18, n = 4 mice, **P=0.002, two-sided Paired sample t-test; Type II: Before, −0.26 ± 0.25; After, −102.5 ± 17.78, n = 8 mice, ***P=0.0007, two-sided Paired sample t-test. Bottom: heatmap of dF/F for all individual trials. j. Top: average GCaMP6s responses to social interaction from both Type I (red) and Type II neurons (blue) of the PVT. The duration of the interaction bouts is depicted by the blue line above the trace (n = 5 mice). Middle: quantification of GCaMP6s responses to social interaction. AUC, Type I: Before, 0.78 ± 0.18; After, −1647.62 ± 294.40, n = 7 mice, ***P=0.0002, two-sided Paired sample t-test; Type II: Before, 1.11 ± 1.50; After, −2316.92 ± 726.56, n = 5 mice, *P=0.033, two-sided Paired sample t-test. Bottom: heatmap of dF/F for all individual trials. k. Top: average GCaMP6s responses to the thermoneutral zone from both Type I (red) and Type II neurons (blue) of the PVT (n = 5 mice). The duration of thermoneutral zone exposure is depicted by the blue line above the trace. Middle: quantification of GCaMP6s responses to the thermoneutral zone. AUC, Type I: Before, 9.69 ± 9.54; After, −495.25 ± 198.34, n = 5 mice, *P=0.046, two-sided Paired sample t-test; Type II: Before, −0.11 ± 0.44; After, −711.94 ± 236.33, n = 6 mice, *P=0.039, two-sided Paired sample t-test. Bottom: heatmap of dF/F for all individual trials. Box chart legend: box is defined by 25th, 75th percentiles, whiskers are determined by 5th and 95th percentiles, and mean is depicted by the square symbol. Data shown as mean ± s.e.m.

