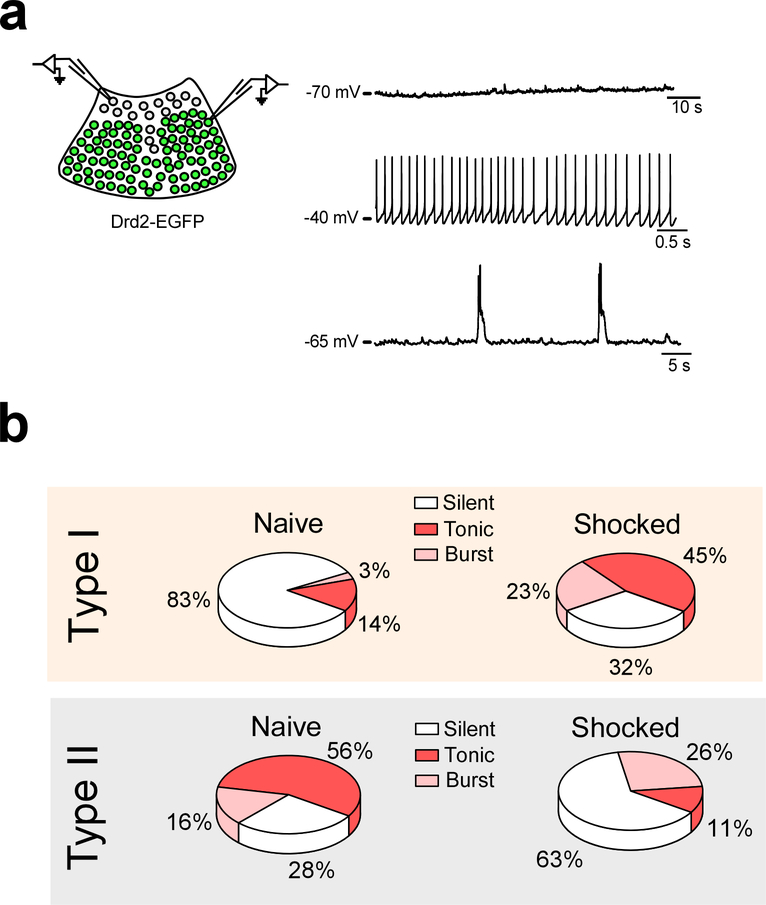
Extended Data Fig. 4. Type I and Type II neurons of the PVT display opposite changes in spontaneous firing in response to an aversive stimulus.
a. Left: schematic of the approach for individually assessing the effect of footshocks on the spontaneous activity of Type I and Type II PVT neurons. Right: sample recordings highlighting the different resting states observed for PVT neurons. Type I and Type II PVT neurons varied in their proportion of silent (top), tonic firing (middle), and burst firing (bottom) cells. b. Pie charts summarizing the proportion of silent (white), tonic firing (red), and burst firing (pink) neurons across naïve and shocked mice for both Type I and Type II subclasses. Naïve: Type I, n = 29 neurons from 4 mice; Type II, n = 32 neurons from 4 mice. Shocked: Type I, n = 22 neurons from 3 mice; Type II, n = 19 neurons from 3 mice.

